Wind Power Parks Market Research Report Information By Application (Residential, Commercial, and Industrial), By Installation (Onshore and Offshore), By Turbine Capacity (<100 KW, 100 KW to 500 KW, 500 KW to 1 MW, 1MW to 3 MW, and & gt; 3 MW), And By Region (North America, Europe, Asia-Pacific, And Rest Of The World) Global Opportunity Analysis and Industry Forecast, 2024-2032
global wind power parks market size was USD 118.61 billion in 2022 and the market to touch USD 479.84 million by 2032, exhibiting a CAGR of 15.0% during the forecast period 2024 - 2032.
The rise in pollution levels in the environment and health issues and increasing awareness of renewable energy sources are the key market drivers enhancing the market growth.
Wind Power Parks Market Trends
A significant increase in demand for renewable energy sources will drive market growth. The wind turbine market is expected to expand due to an enormous increase in demand for renewable energy sources. Governments around the world promote sustainable energy sources because, unlike conventional power sources, they can reduce carbon emissions. Furthermore, offshore Wind Power Parks technology eliminates the sea depth restriction, making it easier to select the best location for power generation. For example, Statoil, the Norwegian energy corporation, committed $268 million to its Hywind turbine project in June 2017.

The project entailed installing floating wind turbines at a depth of 78 metres off Scotland's northeast coast. Furthermore, Wind Power Parks is more efficient than traditional fossil energy sources (coal, natural, and oil). The maximum efficiency of a wind turbine is up to 59%, compared to 35-45% for fossil fuels.
Wind Power Parks has grown dramatically in the last ten years, and it is expected to continue competing in the energy market. Wind energy supplied less than 2% of the world's total power supply in 2010. Its contribution increased by more than 6% in 2020 and is expected to increase by more than 10% by 2030 due to increased generation and capacity.
The total installed wind turbine capacity increased by more than 10% per year from more than 190 gigatonnes (GW) in 2010 to more than 740 GW in 2020. The capacity is expected to grow at a CAGR of more than 9% between 2023 and 2031 to reach a total installed capacity of more than 1800 GW by 2031.
Wind Power Parks Market REPORT SCOPE & SEGMENTATION
|
Report Attribute |
Details |
|
Estimated Market Value (2022) |
118.61 Bn |
|
Projected Market Value (2032) |
479.84 Bn |
|
Base Year |
2022 |
|
Forecast Years |
2024 - 2032 |
|
Scope of the Report |
Historical and Forecast Trends, Industry Drivers and Constraints, Historical and Forecast Market Analysis by Segment- By Application, By Turbine Capacity, By Installation & By Region |
|
Segments Covered |
By Application, By Turbine Capacity, By Installation & By Region |
|
Forecast Units |
Value (USD Billion), and Volume (Units) |
|
Quantitative Units |
Revenue in USD million/billion and CAGR from 2024 to 2032 |
|
Regions Covered |
North America, Europe, Asia Pacific, Latin America, and Middle East & Africa, and Rest of World |
|
Countries Covered |
U.S., Canada, Mexico, U.K., Germany, France, Italy, Spain, China, India, Japan, South Korea, Brazil, Argentina, GCC Countries, and South Africa, among others |
|
Report Coverage |
Market growth drivers, restraints, opportunities, Porter’s five forces analysis, PEST analysis, value chain analysis, regulatory landscape, market attractiveness analysis by segments and region, company market share analysis, and COVID-19 impact analysis. |
|
Delivery Format |
Delivered as an attached PDF and Excel through email, according to the purchase option. |
The Wind Power Parks industry in the United States has been steadily expanding as a result of favorable regulations for new Wind Power Parks installations. Wind energy will provide 9.2% of the electricity produced in the United States in 2021. Because of the increasing viability of onshore and offshore wind farms and the acceleration of expansion, demand for wind turbines is expected to rise during the forecast period, driving revenue growth in the Wind Power Parks market.
Wind Power Parks Market Segment Insights:
Wind Power Parks Application Insights
The Wind Power Parks Market is divided into three applications: residential, commercial, and industrial. In 2022, the industrial segment accounted for the majority of Wind Power Parks Market revenue. Large wind farms with multiple turbines connected to the country's transmission network are frequently used for industrial Wind Power Parks. Large-scale utility-scale wind turbine projects necessitate a number of land, building, and other permissions, as well as careful relationship management with various process players. The removal of barriers to the installation of utility-scale projects is expected to fuel the industrial segment's growth.
Wind Power Parks Installation Insights
The Wind Power Parks Market is divided into two segments based on installation: onshore and offshore. The onshore segment dominated the market in 2021 and is expected to be the fastest-growing segment between 2023 and 2031. Onshore Wind Power Parks has become the most popular renewable energy source in all areas due to its lower cost than offshore Wind Power Parks, simple installation procedures, and reduction in greenhouse gas emissions (GHG). The Levelized Cost of Electricity (LCOE) for established onshore wind projects is already low when compared to fossil fuel generation sources. This trend is expected to continue in the future, lowering installation costs and improving Wind Power Parks plant performance, positively impacting market growth.
Wind Power Parks Turbine Capacity Insights
The Wind Power Parks Market data has been divided into four categories based on turbine capacity: 100 KW, 100 KW to 500 KW, 500 KW to 1 MW, 1MW to 3 MW, and > 3 MW. The > 3 MW segment dominated the market in 2021 and is expected to be the fastest-growing segment from 2023 to 2031. In 2021, the average capacity of newly installed wind turbines in the United States was 3.0 megawatts (MW), up 9% from 2020 and 319% from 1998-1999. In 2021, the number of turbines installed in the 2.75-3.5 MW category increased, as did the percentage of turbines 3.5 MW or larger. Lower costs are eventually realized because higher-capacity turbines necessitate fewer turbines to produce the same amount of energy across a wind farm.
Wind Power Parks Regional Insights
The study divides the market into four regions: North America, Europe, Asia-Pacific, and the Rest of the World. The North American Wind Power Parks market was worth USD 46.49 billion in 2021 and is expected to grow at a significant CAGR during the study period. Because of the enormous wind energy potential and the decline in the cost of sophisticated technology, the industry is expected to see a wide range of commercial prospects during the forecast period.
Europe has the second-largest market share for Wind Power Parks. Wind Power Parks demand is expected to increase during the projection period due to falling Wind Power Parks generation costs, rising environmental awareness, and financial incentives from numerous governments. Furthermore, the Wind Power Parks market in Germany had the largest market share, while the Wind Power Parks market in the United Kingdom was the fastest-growing market in the European region.
From 2024 to 2032, the Asia-Pacific Wind Power Parks Market is expected to grow at the fastest CAGR. China has the highest installation in the area due to the government's ongoing actions and investments to support industrial growth. Furthermore, China's Wind Power Parks market had the largest market share, while India's Wind Power Parks market was the Asia-Pacific region's fastest-growing market.
Wind Power Parks Key Market Players
Major market players are investing heavily in R&D to expand their product lines, which will help the Wind Power Parks market grow even further. Market participants are also pursuing a variety of strategic initiatives to expand their global footprint, including new product launches, contractual agreements, mergers and acquisitions, increased investments, and collaboration with other organizations. Wind energy competitors must offer cost-effective products in order to expand and survive in an increasingly competitive and rising market environment.
Recent Developments
August 2022: EDF Renewables and Ferrovial's Polish subsidiary Budimex signed a memorandum of understanding in August 2022 to implement investments in the development of offshore wind farms in Poland. The two companies will work together on the country's second stage of offshore development.
November 2021: Google has committed to purchasing 50 MW of wind energy from a Danish energy giant's offshore wind farm in the German North Sea in November 2021. The 12-year Corporate Power Purchase Agreement (CPPA) will assist Google in meeting its goal of using carbon-free electricity in all of its data centres by 2030.
Key Benefits of the Report
Wind Power Parks Market Report Segmentation
|
ATTRIBUTE |
DETAILS |
|
By Turbine Capacity |
|
|
By Installation |
|
|
By Application |
|
|
By Geography |
|
|
Customization Scope |
|
|
Pricing |
|
The Report Answers Questions Such As:
Research Methodology
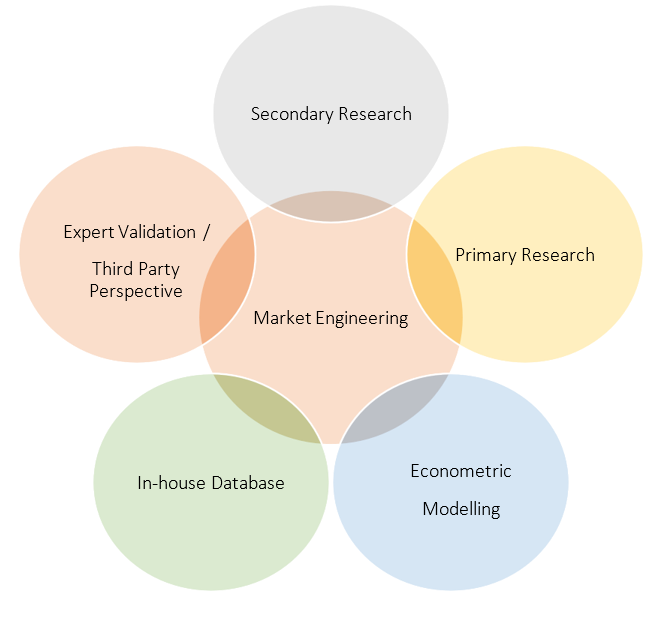
Our research methodology has always been the key differentiating reason which sets us apart in comparison from the competing organizations in the industry. Our organization believes in consistency along with quality and establishing a new level with every new report we generate; our methods are acclaimed and the data/information inside the report is coveted. Our research methodology involves a combination of primary and secondary research methods. Data procurement is one of the most extensive stages in our research process. Our organization helps in assisting the clients to find the opportunities by examining the market across the globe coupled with providing economic statistics for each and every region. The reports generated and published are based on primary & secondary research. In secondary research, we gather data for global Market through white papers, case studies, blogs, reference customers, news, articles, press releases, white papers, and research studies. We also have our paid data applications which includes hoovers, Bloomberg business week, Avention, and others.
Data Collection
Data collection is the process of gathering, measuring, and analyzing accurate and relevant data from a variety of sources to analyze market and forecast trends. Raw market data is obtained on a broad front. Data is continuously extracted and filtered to ensure only validated and authenticated sources are considered. Data is mined from a varied host of sources including secondary and primary sources.
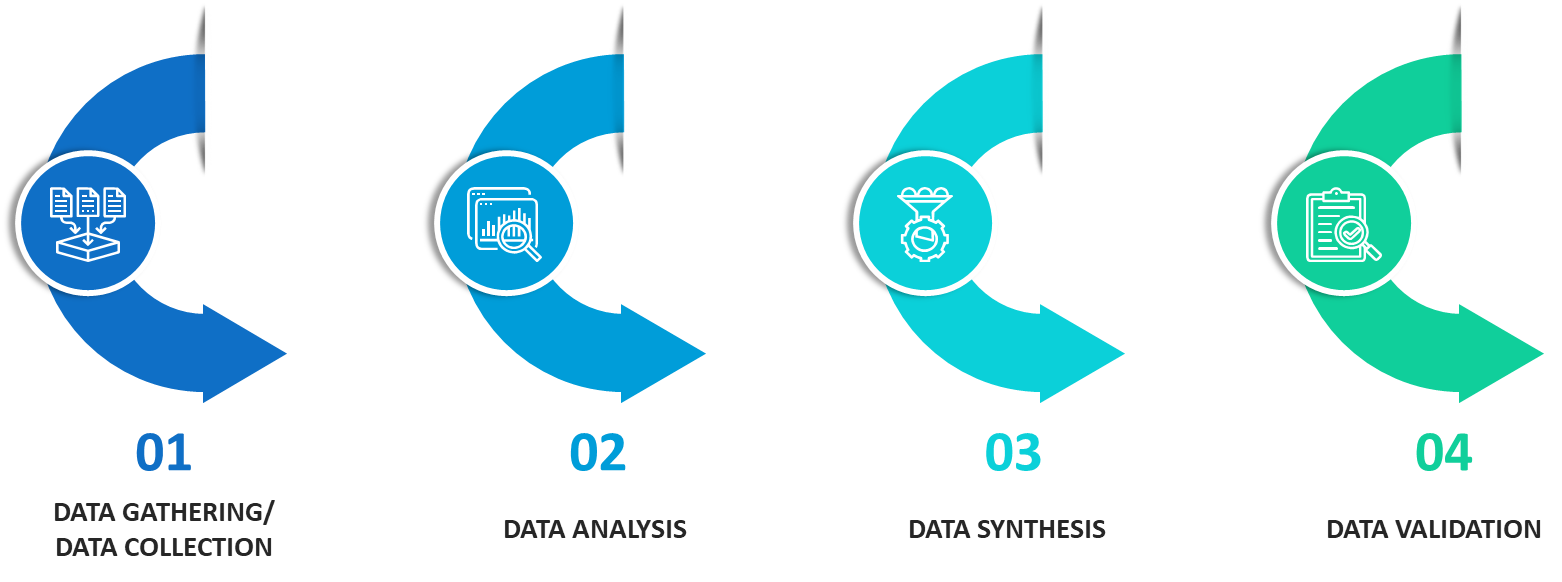
Primary Research
After the secondary research process, we initiate the primary research phase in which we interact with companies operating within the market space. We interact with related industries to understand the factors that can drive or hamper a market. Exhaustive primary interviews are conducted. Various sources from both the supply and demand sides are interviewed to obtain qualitative and quantitative information for a report which includes suppliers, product providers, domain experts, CEOs, vice presidents, marketing & sales directors, Type & innovation directors, and related key executives from various key companies to ensure a holistic and unbiased picture of the market.
Secondary Research
A secondary research process is conducted to identify and collect information useful for the extensive, technical, market-oriented, and comprehensive study of the market. Secondary sources include published market studies, competitive information, white papers, analyst reports, government agencies, industry and trade associations, media sources, chambers of commerce, newsletters, trade publications, magazines, Bloomberg BusinessWeek, Factiva, D&B, annual reports, company house documents, investor presentations, articles, journals, blogs, and SEC filings of companies, newspapers, and so on. We have assigned weights to these parameters and quantified their market impacts using the weighted average analysis to derive the expected market growth rate.
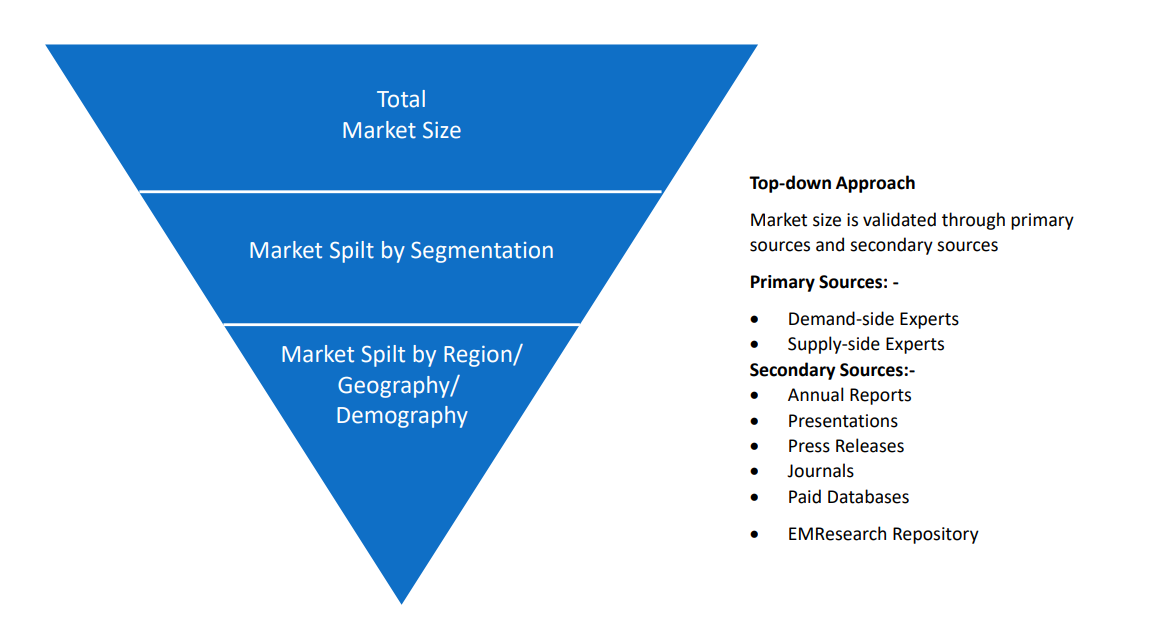
Top-Down Approach & Bottom-Up Approach
In the top – down approach, the Global Batteries for Solar Energy Storage Market was further divided into various segments on the basis of the percentage share of each segment. This approach helped in arriving at the market size of each segment globally. The segments market size was further broken down in the regional market size of each segment and sub-segments. The sub-segments were further broken down to country level market. The market size arrived using this approach was then crosschecked with the market size arrived by using bottom-up approach.
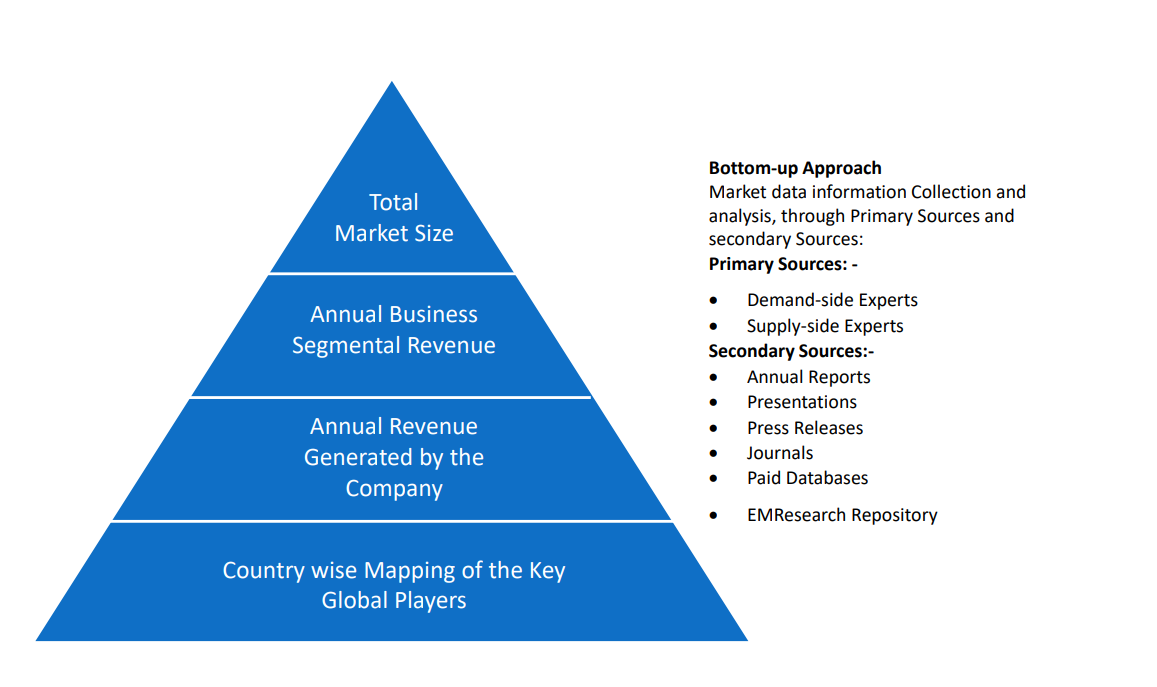
In the bottom-up approach, we arrived at the country market size by identifying the revenues and market shares of the key market players. The country market sizes then were added up to arrive at regional market size of the decorated apparel, which eventually added up to arrive at global market size.
This is one of the most reliable methods as the information is directly obtained from the key players in the market and is based on the primary interviews from the key opinion leaders associated with the firms considered in the research. Furthermore, the data obtained from the company sources and the primary respondents was validated through secondary sources including government publications and Bloomberg.
Market Analysis & size Estimation
Post the data mining stage, we gather our findings and analyze them, filtering out relevant insights. These are evaluated across research teams and industry experts. All this data is collected and evaluated by our analysts. The key players in the industry or markets are identified through extensive primary and secondary research. All percentage share splits, and breakdowns have been determined using secondary sources and verified through primary sources. The market size, in terms of value and volume, is determined through primary and secondary research processes, and forecasting models including the time series model, econometric model, judgmental forecasting model, the Delphi method, among Flywheel Energy Storage. Gathered information for market analysis, competitive landscape, growth trends, product development, and pricing trends is fed into the model and analyzed simultaneously.
Quality Checking & Final Review
The analysis done by the research team is further reviewed to check for the accuracy of the data provided to ensure the clients’ requirements. This approach provides essential checks and balances which facilitate the production of quality data. This Type of revision was done in two phases for the authenticity of the data and negligible errors in the report. After quality checking, the report is reviewed to look after the presentation, Type and to recheck if all the requirements of the clients were addressed.