Water Park Market Size, Share, Trends, Growth, and Industry Analysis, By Type (Amusement Water Parks, Indoor Water Parks, Outdoor Water Parks), Revenue Source (Ticket Sales, Food & Beverage, Merchandise, Sponsorships & Advertising), Target Audience (Families, Teenagers & Young Adults, Corporate Groups, Schools & Educational Groups), Attractions (Water Slides, Wave Pools, Lazy Rivers, Aqua Play Structures, Interactive Water Features), Ownership (Private-Owned, Government-Owned, Public-Private Partnerships), Regional Analysis and Forecast 2033.
Global Water Park Market size was USD 5.73 billion in 2024 and the market is projected to touch USD 8.94 billion by 2033, at a CAGR of 5.72% during the forecast period.
Water parks usually feature water slides, wave pools, lazy rivers, and other such water attractions designed for entertainment. Water parks are popular among families, tourists, and thrill-seekers as they offer a mix of fun and relaxation. The market includes both standalone water parks and those integrated with resorts or theme parks. The water park market has grown largely over the past few years, mainly because of an increase in disposable income, an increase in family vacations, and growth in the demand for outdoor forms of entertainment.
Technology too has been another key player where parks will be introducing new thrill rides that include virtual reality and new advanced water filtration systems. Furthermore, the growth of tourism and the increased popularity of wellness and health-related leisure activities have also fueled the demand for water parks. As water parks continue to focus on safety, sustainability, and variety, they are becoming an important part of the global tourism and leisure industry.
Water Park Report Scope and Segmentation
|
Report Attribute |
Details |
|
Estimated Market Value (2024) |
USD 5.73 Billion |
|
Projected Market Value (2033) |
USD 8.94 Billion |
|
Base Year |
2024 |
|
Historical Year |
2018-2023 |
|
Forecast Years |
2025 – 2033 |
|
Scope of the Report |
Historical and Forecast Trends, Industry Drivers and Constraints, Historical and Forecast Market Analysis by Segment- Based on By Type, Revenue Source, Target Audience, Attractions, Ownership, & Region. |
|
Segments Covered |
By Type, Revenue Source, Target Audience, Attractions, Ownership, & By Region. |
|
Forecast Units |
Value (USD Million or Billion), and Volume (Units) |
|
Quantitative Units |
Revenue in USD million/billion and CAGR from 2025 to 2033. |
|
Regions Covered |
North America, Europe, Asia Pacific, Latin America, and Middle East & Africa. |
|
Countries Covered |
U.S., Canada, Mexico, U.K., Germany, France, Italy, Spain, China, India, Japan, South Korea, Brazil, Argentina, GCC Countries, and South Africa, among others. |
|
Report Coverage |
Market growth drivers, restraints, opportunities, Porter’s five forces analysis, PEST analysis, value chain analysis, regulatory landscape, market attractiveness analysis by segments and region, company market share analysis. |
|
Delivery Format |
Delivered as an attached PDF and Excel through email, according to the purchase option. |
Dynamic Insights
The primary reason is the rising disposable income of consumers, allowing more families to spend money on leisure activities such as visiting water parks. With the increase in tourism, resorts or water parks within tourist destinations are also gaining popularity. The trend of family-friendly entertainment options is also growing in this market, as water parks offer a variety of attractions for all age groups, from thrilling slides to relaxing water activities. Moreover, innovations such as water-based adventure rides, VR experiences, and eco-friendly attractions are attracting more visitors, pushing market growth.
However, the significant initial capital investment and continuous operational expenses, for instance, pose major barriers to rapid market growth, especially within developing economies. Regular maintenance and related safety measures increase operational expenses, while varied weather patterns and seasonal fluctuations impact revenues, as water parks are considered in higher demand within warmer climate zones and summer periods. Further regulatory concerns over the conservancy of water, proper disposal of wastes, and general safety standards further hamper development and operation in the sector. Growth, however continues, driven by rising interest in sustainable practices, enhanced technology, and visitor experiences worldwide in water parks.
Drivers Insights
As global disposable incomes rise, especially in emerging economies, consumers tend to spend more of their consumption on recreational activities and family entertainments. A water park offers different kinds of attractions suitable for all age groups and is considered an excellent investment for family vacations. With this increase in disposable income, consumer demand for leisure and entertainment services will rise, thus positively boosting the growth of the water park market. In addition, growing living standards and urbanization imply that more individuals can afford travel to domestic as well as overseas destinations with water parks, resulting in increased foot traffic and, consequently, more revenue for the operators.
Water parks have evolved into a perfect choice for family outings because of the variety of activities that suits different age groups and interests, be it just a lazy river for relaxation or something splashier like water slides. This family appeal has grown the market because most consumer activity typically involves activity in which all family members can participate, and the trend of family vacations and bonding experiences is growing. In addition, family-oriented promotions and packages from water parks attract more families, thereby increasing the demand for such recreational places..
Restraints Insights
Water parks face one of the greatest capital expenditures as part of developing and maintaining their infrastructure. Water parks are built on huge capital investments, such as land acquisition, attraction development, water systems, and safety equipment. Other high operational costs may include water management, staffing, maintenance, and regulatory compliance. Such costs will, therefore, hinder growth within the market, especially for new entrants or operators in less affluent spending regions. The high costs also pose financial risks, especially during off-peak seasons when visitor numbers are lower.
Water parks are seasonal places, where the majority of its visitors usually throng it when the climate is warm or when it's tropical. Such a seasonability affects the overall possible revenue for such parks in an entire year. Unpredictable weather like rainfall or spells of cold also lowers attendance as not many will opt to go out to a water park on bad weather days. In temperate climates, water parks often experience fluctuations in revenue during the off-season, making it difficult for operators to attract visitors throughout the year, either by indoor water parks or special events.
Opportunities Insights
With the increased awareness of environmental issues, water parks can portray the opportunity to adopt greener practices and eco-friendly attractions. It could be through water-efficient systems, solar energy, recycling of waste, and green spaces incorporated inside the water parks. More and more travelers are only traveling in an environment-friendly manner as given priority over other preferences.
Water parks using green technologies will certainly outshine their competitors within a cut-throat market. Furthermore, eco-friendly attractions, such as water parks constructed from sustainable materials or those emphasizing environmental awareness, can attract a niche segment of environmentally aware visitors. Implementing these practices not only helps protect the environment but also offers a unique selling point to potential customers.
Segment Analysis
The water parks are categorized according to the various types of the park, such as amusement water parks, indoor water parks, and outdoor water parks. Amusement water parks refer to large parks combining water attractions with other amusement rides, meaning the parks would typically offer more diversity in their forms of entertainment. Indoor water parks are indoor facilities that enable year-round operations, thus reducing their dependency on weather conditions, which is especially beneficial in colder climates.
Outdoor water parks, on the other hand, are open-air parks that are visited during warm months and often have large-scale water attractions such as wave pools, lazy rivers, and slides. Each type of park has its appeal and challenges: indoor parks, focusing on extended operational periods; outdoor parks, emphasizing seasonal appeal; and amusement parks, offering diversified entertainment for all ages.
The revenue streams of water parks are diverse and primarily come from ticket sales, food and beverage services, merchandise, and sponsorships & advertising. Ticket sales form the backbone of the water park’s revenue, as visitors pay for entry to access various attractions. Food and beverage sales generate a significant portion of revenue, as many visitors spend money on snacks, meals, and drinks while enjoying the park. Merchandise, such as branded clothing, toys, and accessories, adds another revenue stream. Sponsorships and advertising are growing sources of income, as companies see the value in associating their brands with popular leisure destinations like water parks.
Water parks generally target all levels of audiences: key segments are composed of families, teenagers & young adults, corporate groups, schools & educational groups. Families can be said to be the target audience because these water parks prove to be wonderful places where any age group and family members are bonded with much fun and entertaining.
Teenagers and young adults go there looking for the high thrill rides offered and for good social life. Corporate groups usually make use of water parks for team building and fun events. Group rates and packages can be arranged. Schools and other educational groups often like to hold field trips in water parks because it combines learning with fun in an interactive setting.
Attraction is important as it attracts different types of people to come visit the park, and they come because the park offers interesting features. A wave pool or an aqua play structure could also be in that list because the attractions for this type of amusement park differ based on size. Water parks provide a huge list of various kinds of amusement with water slides.
Wave pools provide the simulated ocean waves' feeling, thereby allowing people to experience fun moments or relaxing themselves. Lazy rivers offer a more leisurely attraction where visitors can float on tubes through a winding water course. Aqua play structures are interactive play areas for younger children, which offer smaller slides, water fountains, and sprinklers. Interactive water features like water cannons and splash pads make the experience even better by providing interesting activities to be undertaken for all ages.
Water parks can be categorized based on ownership into private-owned, government-owned, and public-private partnerships (PPP). Private-owned water parks tend to be run by private companies. They seek a maximum profit by providing diverse attractions and services to be attractive enough to the visitor. Government-owned water parks are dominated by local, state, or national governments. It tends to operate mainly with the aim of providing low-cost recreational facility to the public.
These parks can also be on local tourism or public health. Public-private partnerships (PPP) combine the strength of both sectors, where private companies collaborate with the government to fund, develop, and operate water parks. The partnership usually focuses on improving the infrastructure and services of the park while sharing the financial and operational risks.
Regional Analysis
North America remains a leading segment in terms of market share; the well-developed tourism sector, higher disposable incomes, and large indoor as well as outdoor water parks facilitate this market segment. In North America, one of the leaders is the United States, and it hosts many of the largest water parks across the world that attract millions of domestic as well as international visitors. Technological innovation in water attractions, including virtual reality-based rides and interactive water features, maintains parks competitive, while the market in North America is mature. Future growth in this region might be influenced by new developments in eco-friendly water parks and seasonal offerings.
Meanwhile, the water park market in the Asia-Pacific region is rapidly growing, driven by increasing urbanization, an increase in disposable income, and growing interest in family-friendly leisure activities. Countries such as China, India, and Japan are seeing significant investments in both large-scale outdoor water parks and indoor facilities, trying to capitalize on the growing tourism sector and a young middle-class population. Southeast Asian countries, such as Thailand and Indonesia, are also coming up as a significant market due to their high tourism industries. Europe is also a market that focuses on family tourism and water-based attractions, especially in countries like Spain, Germany, and France. In the Middle East and Africa, luxury water parks are being developed within resorts and hotels, targeting high-income tourists.
Competitive Landscape
Major international players in the global market include Universal Parks & Resorts, Six Flags Entertainment Corporation, and Disney Parks, which operate large, multi-location water parks offering a wide array of attractions, services, and brand recognition. These companies leverage their well-established brands and large-scale investments to attract visitors, often integrating water parks into broader entertainment complexes that include theme parks, hotels, and resorts. Besides that, they invest in innovative technologies and eco-friendly features to help their products and services stand out from the crowd in this highly competitive leisure and tourism market.
Regional players also account for a considerable share in the market. Companies like WhiteWater West, ProSlide Technology, and Aquatic Development Group specialize in the design and construction of water parks and offer unique water attractions and solutions that aim to provide the perfect water park experience for public and private operators to embrace new and creative water-based attractions. Other market participants include the smaller, regional water park operators. In recent years, local players have thrived in most emerging economies by providing family-oriented entertainment options, especially for middle-class families with young children. Regional players specialize in niche offers and cost-efficient solutions, satisfying local preferences and markets.
Apart from the existing players, the new market entrants are making use of this trend towards indoor water parks and eco-friendly attractions. These new entrants reduce environmental impact, enhance visitor experience through technology, and provide entertainment throughout the year. With growing competition, strategic partnerships, mergers, and acquisitions are frequent in this area, which allow companies to extend their portfolios and enhance their competitive positioning in the global water park market.
List of Key Players
Recent Developments
Global Water Park Report Segmentation
|
ATTRIBUTE |
DETAILS |
|
By Type of Parks |
|
|
By Revenue Source |
|
|
By Target Audience |
|
|
By Attractions |
|
|
By Ownership |
|
|
By Geography |
|
|
Customization Scope |
|
|
Pricing |
|
Research Methodology
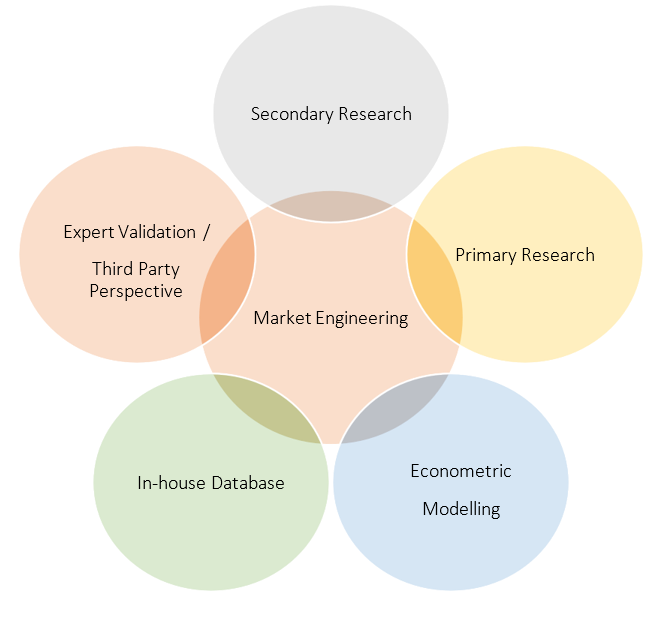
Our research methodology has always been the key differentiating reason which sets us apart in comparison from the competing organizations in the industry. Our organization believes in consistency along with quality and establishing a new level with every new report we generate; our methods are acclaimed and the data/information inside the report is coveted. Our research methodology involves a combination of primary and secondary research methods. Data procurement is one of the most extensive stages in our research process. Our organization helps in assisting the clients to find the opportunities by examining the market across the globe coupled with providing economic statistics for each and every region. The reports generated and published are based on primary & secondary research. In secondary research, we gather data for global Market through white papers, case studies, blogs, reference customers, news, articles, press releases, white papers, and research studies. We also have our paid data applications which includes hoovers, Bloomberg business week, Avention, and others.
Data Collection
Data collection is the process of gathering, measuring, and analyzing accurate and relevant data from a variety of sources to analyze market and forecast trends. Raw market data is obtained on a broad front. Data is continuously extracted and filtered to ensure only validated and authenticated sources are considered. Data is mined from a varied host of sources including secondary and primary sources.

Primary Research
After the secondary research process, we initiate the primary research phase in which we interact with companies operating within the market space. We interact with related industries to understand the factors that can drive or hamper a market. Exhaustive primary interviews are conducted. Various sources from both the supply and demand sides are interviewed to obtain qualitative and quantitative information for a report which includes suppliers, product providers, domain experts, CEOs, vice presidents, marketing & sales directors, Type & innovation directors, and related key executives from various key companies to ensure a holistic and unbiased picture of the market.
Secondary Research
A secondary research process is conducted to identify and collect information useful for the extensive, technical, market-oriented, and comprehensive study of the market. Secondary sources include published market studies, competitive information, white papers, analyst reports, government agencies, industry and trade associations, media sources, chambers of commerce, newsletters, trade publications, magazines, Bloomberg BusinessWeek, Factiva, D&B, annual reports, company house documents, investor presentations, articles, journals, blogs, and SEC filings of companies, newspapers, and so on. We have assigned weights to these parameters and quantified their market impacts using the weighted average analysis to derive the expected market growth rate.
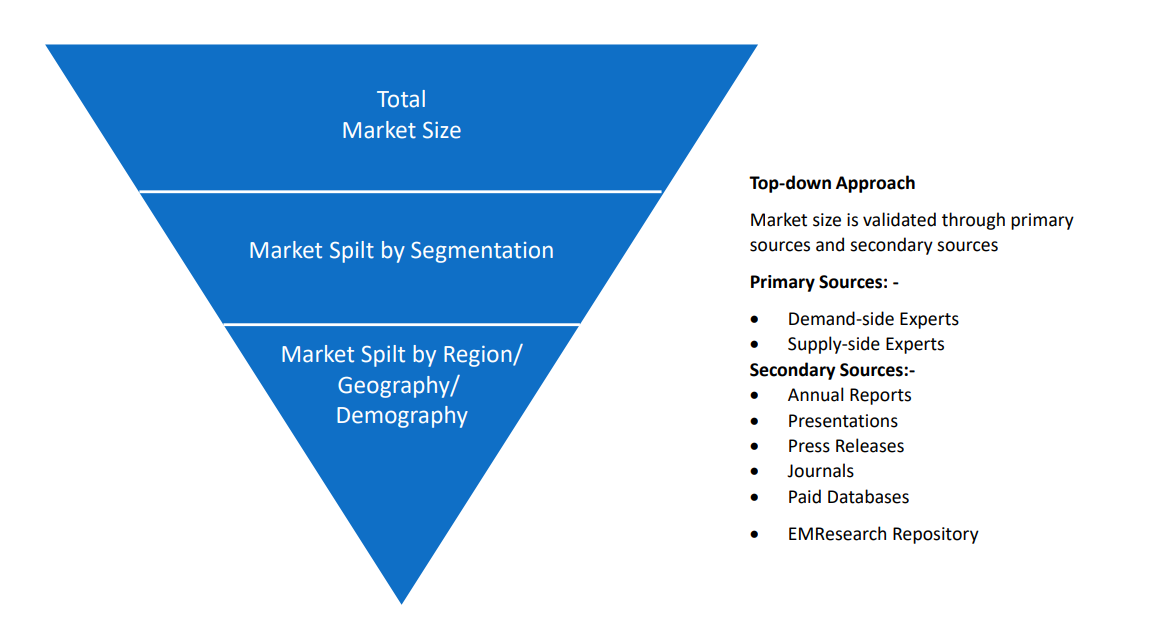
Top-Down Approach & Bottom-Up Approach
In the top – down approach, the Global Batteries for Solar Energy Storage Market was further divided into various segments on the basis of the percentage share of each segment. This approach helped in arriving at the market size of each segment globally. The segments market size was further broken down in the regional market size of each segment and sub-segments. The sub-segments were further broken down to country level market. The market size arrived using this approach was then crosschecked with the market size arrived by using bottom-up approach.
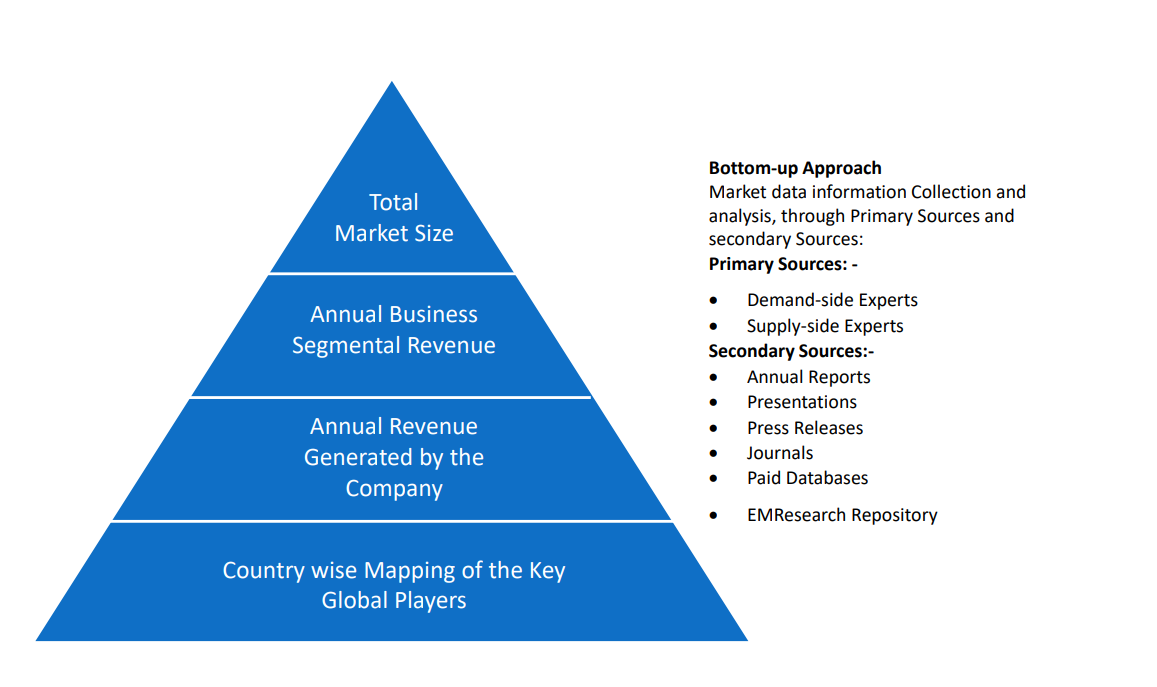
In the bottom-up approach, we arrived at the country market size by identifying the revenues and market shares of the key market players. The country market sizes then were added up to arrive at regional market size of the decorated apparel, which eventually added up to arrive at global market size.
This is one of the most reliable methods as the information is directly obtained from the key players in the market and is based on the primary interviews from the key opinion leaders associated with the firms considered in the research. Furthermore, the data obtained from the company sources and the primary respondents was validated through secondary sources including government publications and Bloomberg.
Market Analysis & size Estimation
Post the data mining stage, we gather our findings and analyze them, filtering out relevant insights. These are evaluated across research teams and industry experts. All this data is collected and evaluated by our analysts. The key players in the industry or markets are identified through extensive primary and secondary research. All percentage share splits, and breakdowns have been determined using secondary sources and verified through primary sources. The market size, in terms of value and volume, is determined through primary and secondary research processes, and forecasting models including the time series model, econometric model, judgmental forecasting model, the Delphi method, among Flywheel Energy Storage. Gathered information for market analysis, competitive landscape, growth trends, product development, and pricing trends is fed into the model and analyzed simultaneously.
Quality Checking & Final Review
The analysis done by the research team is further reviewed to check for the accuracy of the data provided to ensure the clients’ requirements. This approach provides essential checks and balances which facilitate the production of quality data. This Type of revision was done in two phases for the authenticity of the data and negligible errors in the report. After quality checking, the report is reviewed to look after the presentation, Type and to recheck if all the requirements of the clients were addressed.
 +1 812 506 4440
 +91 7875074426