Van Conversion Market Size, Share, Trends, Growth, and Industry Analysis, By Product Type (Base Builds and Upgrade), By Vehicle Type (Full-Size Vans, Mid-Size Vans, and Compact Vans), By Application (Commercial Use and Personal Use), By Price Range (Economy Conversions, Mid-Range Conversions, and Premium Conversions), By Conversion Type (Campervan Conversions, Commercial Van Conversions, Specialty Conversions), Regional Insights and Forecast to 2032
global van conversion market size was USD 8.05 billion in 2023 and is predicted to reach USD 16.47 billion in 2032, exhibiting at a CAGR of 8.28% during the forecast period.
The market for van conversions has grown significantly in recent years due to increased interest in sustainable travel and alternative lifestyles. Van conversions are a flexible and customizable way to turn regular vans into mobile homes that are ideal for digital nomads, adventurers, and those who love minimalist living. This market draws a wide spectrum of customers looking for distinctive travel experiences because of the allure of independence and self-sufficiency. Van conversion firms offer creative ways to satisfy the changing needs of modern living, from off-grid capabilities to opulent amenities. The van conversion market offers businesses and consumers alike significant options as the trend continues to gain traction.

VAN CONVERSION MARKET: REPORT SCOPE & SEGMENTATION
|
Report Attribute |
Details |
|
Estimated Market Value (2023) |
8.05 Bn |
|
Projected Market Value (2032) |
16.47 Bn |
|
Base Year |
2023 |
|
Forecast Years |
2024 - 2032 |
|
Scope of the Report |
Historical and Forecast Trends, Industry Drivers and Constraints, Historical and Forecast Market Analysis by Segment- By Product Type, By Vehicle Type, By Application, By Price Range, By Conversion Type, & Region |
|
Segments Covered |
By Product Type, By Vehicle Type, By Application, By Price Range, By Conversion Type, & Region |
|
Forecast Units |
Value (USD Billion or Million), and Volume (Units) |
|
Quantitative Units |
Revenue in USD million/billion and CAGR from 2024 to 2032 |
|
Regions Covered |
North America, Europe, Asia Pacific, Latin America, and Middle East & Africa, and the Rest of World |
|
Countries Covered |
U.S., Canada, Mexico, U.K., Germany, France, Italy, Spain, China, India, Japan, South Korea, Brazil, Argentina, GCC Countries, and South Africa, among others |
|
Report Coverage |
Market growth drivers, restraints, opportunities, Porter’s five forces analysis, PEST analysis, value chain analysis, regulatory landscape, market attractiveness analysis by segments and region, company market share analysis, and COVID-19 impact analysis. |
|
Delivery Format |
Delivered as an attached PDF and Excel through email, according to the purchase option. |
Global Van Conversion Dynamics
Demand is driven by shifting consumer attitudes toward experiential travel and eco-friendly living. Environmentally conscious consumers are drawn to creative designs and eco-friendly solutions made possible by technological breakthroughs. Affordability and consumer spending on luxuries vs necessities are impacted by changes in the economy. Manufacturing procedures and product offers are impacted by regulatory changes in vehicle requirements and emissions. Pricing tactics and innovation are stimulated by competition among van conversion companies. Brand reputation and market visibility are significantly impacted by social media and online communities. In general, a complicated interaction between laws, trends, technology, and customer behavior shapes the direction of the van conversion business.
Global Van Conversion Drivers
The desire for nomadic lives is growing due to a shift in culture that values simplicity, freedom, and adventure. People are looking for unusual housing that allows them to travel and explore more and more. The allure of van life and nomadic living is attributed to a number of factors, including a desire for novel experiences, flexible work schedules, and a break from conventional social conventions. Social media influencers are the driving force behind this trend because they romanticize the freedom and adventure that come with traveling and encourage others to adopt a similar lifestyle.
The ability of technological improvements to facilitate seamless connectivity and cooperation regardless of location is the primary driver behind the shift towards remote work. In an effort to draw and retain talent, cut expenses, and support work-life balance, businesses are adopting remote work policies more and more as a result of the proliferation of digital communication tools and cloud-based platforms. This tendency has also been hastened by the COVID-19 epidemic, which has brought attention to the advantages and viability of remote work. As a result, remote work techniques have been widely accepted and used across a variety of businesses.
Restraints:
The cost of finding a suitable van and the conversion process itself, which includes labor, supplies, and customization, can be too much for a lot of people to bear. The decision-making process is further complicated by the uncertainty surrounding the return on investment and resale value of the converted van, which restricts market accessibility and the uptake of van conversions as a practical housing solution.
One significant barrier to the van conversion market is the scarcity of skilled conversion professionals. Finding qualified experts that can complete high-quality conversions might be difficult because van conversions are a specialized service. Because of their scarcity, there is more rivalry for their services, which raises prices, lengthens wait times, and may produce results that are of inferior quality. Furthermore, the lack of experts may discourage prospective clients from pursuing van conversions entirely, impeding the expansion and advancement of the sector.
Opportunities:
Through expanding their customer base to include families, seniors, and professionals looking for alternate living options, conversion companies can reach new and varied market niches. This growth creates opportunities for cutting-edge features and designs catered to particular requirements and tastes, making van conversions more appealing to a larger market. Additionally, focusing on niche markets with specific needs, such as accessible conversions for people with disabilities, can help to further distinguish products and promote expansion.
Reaching out to foreign markets can greatly increase your customer base and revenue streams, especially with the increasing interest in van life and alternative lifestyles around the world. Businesses can forge a solid foothold in new markets by customizing their goods and services to satisfy a range of cultural preferences and legal requirements. Market entry and long-term growth in unexplored markets can be facilitated through targeted marketing campaigns, international trade show participation, and collaborations with local partners.
Segment Overview
Based on product type, the global van conversion market is divided into base builds and upgrades. Base constructions are the fundamental transformation of a regular cargo van into a habitable area. This entails converting a van's empty shell into a usable living space, including adding insulation, walls, flooring, rudimentary electrical wiring, and occasionally plumbing infrastructure. Upgrades include adding new features, making improvements, or altering an existing van conversion to make it more comfortable, functional, or aesthetically pleasing. These could involve adding luxury features like high-end finishes or bespoke cabinetry, installing cutting-edge electrical systems, modernizing appliances, incorporating smart home technologies, or improving off-grid capabilities with solar panels and auxiliary power systems.
Based on the vehicle type, the global van conversion market is categorized into full-size vans, mid-size vans, and compact vans. The full-size vans category leads the global van conversion market with the largest revenue share in 2023. The most popular vehicle category for conversions is full-size vans. Typically, these vans have roomy cabins, lots of headroom, and a sizable load capacity. Full-size vans come in the Mercedes-Benz Sprinter, Ford Transit, and Ram ProMaster types, to name a few. In terms of size and interior space, mid-size vans fall between full-size and small vans. They provide a good mix of interior space, fuel economy, and maneuverability. The smallest type of vehicles frequently utilized for conversions are called compact vans. These vans are renowned for their small size, which makes them simple to handle in confined locations and urban settings.
Based on application, the global van conversion market is segmented into commercial use and personal use. The commercial use segment dominates the van conversion market. Vans that have been modified for commercial use are made to meet particular professional or company requirements. Vans transformed into mobile workshops furnished with specialist instruments and apparatuses for craftsmen including mechanics, carpenters, electricians, and plumbers. Vans were transformed into mobile clinics or healthcare facilities that offered necessary medical care in disadvantaged or rural places. Personal van conversions serve people or families looking for recreational vehicles, adventure travel options, or alternate living arrangements. vans that have been modified to become camper vans or recreational vehicles (RVs) with amenities including beds, kitchens, and entertainment systems for use on road trips, camping vacations, and outdoor excursions.
Based on price range, the global van conversion market is divided into economy conversions, mid-range conversions, and premium conversions. The mid-range conversions category dominates the market with the largest revenue share in 2023. In comparison to economic conversions, mid-range conversions provide more comfort, convenience, and personalization while maintaining an affordable price point. Economy conversions are distinguished by their low cost and fundamental characteristics. These renovations usually provide the necessities for daily life or leisure activities, appealing to consumers on a tight budget or do-it-yourselfers. In the van conversion industry, premium conversions are the height of comfort, elegance, and personalization; they are designed for discriminating clients who are prepared to shell out money for upscale features and conveniences.
Based on conversion type, the global van conversion market is divided into campervan conversions, commercial van conversions, and specialty conversions. The plastic category dominates the market with the largest revenue share in 2023. Converted campervans are made for leisure use; they provide vacationers, intrepid travelers, and outdoor enthusiasts with cozy and practical living quarters. Usually, these conversions have conveniences to make traveling, camping, and extended periods of time spent on the road easier. Commercial van conversions offer specialized solutions for a variety of commercial uses, all catered to meet certain corporate or professional objectives. For a variety of enterprises and industries, these conversions are made to optimize production, efficiency, and usefulness. Specialty van conversions are a broad category of specially made van conversions intended for specialized uses, one-of-a-kind objectives, or user needs.
Global Van Conversion Overview by Region
The global van conversion market is categorized into North America, Europe, Asia-Pacific, and the Rest of the World. North America emerged as the leading region, capturing the largest market share in 2023. The demand for camper van conversions is fueled by the region's strong outdoor recreation, road tripping, and adventure travel cultures. Van life and other mobile living options are becoming more and more popular in North America due to the continent's strong economy, big number of remote workers, and digital nomads. North America's dominance in the industry is further bolstered by the availability of a large selection of van models that are appropriate for conversion, as well as a flourishing community of van conversion enthusiasts and specialists.
Asia-Pacific is anticipated to post a significant CAGR throughout the forecast period. The market for van conversions in the area is being driven by factors such as rapid urbanization, rising disposable income, and an expanding inclination towards alternative lifestyles. The market is also growing as a result of a growing tourism sector, growing interest in adventure travel, and outdoor activities. Infrastructure and transit network upgrades also promote accessibility and encourage the use of van conversions for both personal and professional use.

Global Van Conversion Competitive Landscape
In the global van conversion market, a few major players exert significant market dominance and have established a strong regional presence. These leading companies remain committed to continuous research and development endeavors and actively engage in strategic growth initiatives, including product development, launches, joint ventures, and partnerships. By pursuing these strategies, these companies aim to strengthen their market position, expand their customer base, and capture a substantial share of the market.
Some of the prominent players in the global van conversion market include,
Global Van Conversion Recent Developments
Scope of the Global Van Conversion Report
Van Conversion Market Report Segmentation
|
ATTRIBUTE |
DETAILS |
|
By Product Type |
|
|
By Vehicle Type |
|
|
By Application |
|
|
By Price Range |
|
|
By Conversion Type |
|
|
By Geography |
|
|
Customization Scope |
|
|
Pricing |
|
Objectives of the Study
The objectives of the study are summarized in 5 stages. They are as mentioned below:
Intended Audience
Chapter 1 INTRODUCTION
1.1 OBJECTIVE OF THE STUDY
1.2 KEY QUESTIONS ANSWERED IN THIS REPORT
1.3 MARKET SCOPE
1.1.1 MARKET SCOPE
1.1.2 CURRENCY AND PRICING
1.1.3 GEOGRAPHIC SCOPE
1.1.4 YEARS CONSIDERATION
Chapter 2 Research Methodology
2.3 RESEARCH ASSUMPTION
Chapter 3 EXECUTIVE SUMMARY
3.1 KEY INSIGHTS OF THE STUDY
Chapter 4 PREMIUM INSIGHT
4.1MARKET ATTRACTIVENESS ANALYSIS
4.1.1 THREAT OF NEW ENTRANTS
4.1.2 BARGAINING POWER OF SUPPLIERS
4.1.3 BARGAINING POWER OF BUYERS
4.1.4 THREAT OF SUBSTITUTES
4.1.5 INTENSITY OF COMPETITIVE RIVALRY IMPACT OF COVID-19 ON THE VAN CONVERSION MARKET VALUE CHAIN ANALYSIS
Chapter 5 MARKET OVERVIEW AND KEY DYNAMICS
5.1 MARKET DRIVERS
5.2 MARKET RESTRAINT
5.1.3 XXXXXXXXXXXXXXXXXXXXXXXXXXXXXXXXXXXXXXXXXXXXXX
5.3 MARKET OPPORTUNITY
5.1.4 XXXXXXXXXXXXXXXXXXXXXXXXXXXXXXXXXXXXXXX
Chapter 6 GLOBAL VAN CONVERSION MARKET, BY TYPE
6.1 INTRODUCTION
6.1.1 GLOBAL VAN CONVERSION MARKET, BY TYPE REVENUE (USD BILLION) (THOUSAND UNITS) (2018-2031), CAGR (%) (2022-2031)
Chapter 7 GLOBAL VAN CONVERSION MARKET, BY APPLICATION
7.1 INTRODUCTION
7.1.1 GLOBAL VAN CONVERSION MARKET, BY APPLICATION REVENUE (USD BILLION) (THOUSAND UNITS) (2018-2031), CAGR (%) (2022-2031)
7.3 P e r s o n a l U s e
Chapter 8 GLOBAL VAN CONVERSION MARKET, BY REGION
8.1 Introduction
8.1.1 GLOBAL VAN CONVERSION MARKET, BY REGIONREVENUE (USD BILLION) (THOUSAND UNITS) (2018-2031), CAGR (%) (2022-2031)
8.1.2 NORTH AMERICA VAN CONVERSION MARKET, BY COUNTRY REVENUE (USD BILLION) (THOUSAND UNITS) (2018-2031), CAGR (%) (2022-2031)
8.1.3 NORTH AMERICA VAN CONVERSION MARKET, BY TYPE REVENUE (USD BILLION) (THOUSAND UNITS) (2018-2031), CAGR (%) (2022-2031)
8.1.4 NORTH AMERICA VAN CONVERSION MARKET, BY APPLICATION REVENUE (USD BILLION) (THOUSAND UNITS) (2018-2031), CAGR (%) (2022-2031)
EUROPE VAN CONVERSION MARKET, BY COUNTRY REVENUE (USD BILLION) (THOUSAND UNITS) (2018-2031), CAGR (%) (2022-2031)
8.1.5 EUROPE VAN CONVERSION MARKET, BY TYPE REVENUE (USD BILLION) (THOUSAND UNITS) (2018-2031), CAGR (%) (2022-2031)
8.1.6 EUROPE VAN CONVERSION MARKET, BY APPLICATION REVENUE (USD BILLION) (THOUSAND UNITS) (2018-2031), CAGR (%) (2022-2031)
APAC VAN CONVERSION MARKET, BY COUNTRY REVENUE (USD BILLION) (THOUSAND UNITS) (2018-2031), CAGR (%) (2022-2031)
8.1.7 APAC VAN CONVERSION MARKET, BY TYPE REVENUE (USD BILLION) (THOUSAND UNITS) (2018-2031), CAGR (%) (2022-2031)
8.1.8 APAC VAN CONVERSION MARKET, BY APPLICATION REVENUE (USD BILLION) (THOUSAND UNITS) (2018-2031), CAGR (%) (2022-2031)
SOUTH AMERICA VAN CONVERSION MARKET, BY COUNTRY REVENUE (USD BILLION) (THOUSAND UNITS) (2018-2031), CAGR (%) (2022-2031)
8.1.9 SOUTH AMERICA VAN CONVERSION MARKET, BY TYPE REVENUE (USD BILLION) (THOUSAND UNITS) (2018-2031), CAGR (%) (2022-2031)
8.1.10 SOUTH AMERICA VAN CONVERSION MARKET, BY APPLICATION REVENUE (USD BILLION) (THOUSAND UNITS) (2018-2031), CAGR (%) (2022-2031)
MEA VAN CONVERSION MARKET, BY COUNTRY REVENUE (USD BILLION) (THOUSAND UNITS) (2018-2031), CAGR (%) (2022-2031)
8.1.11 MEA VAN CONVERSION MARKET, BY TYPE REVENUE (USD BILLION) (THOUSAND UNITS) (2018-2031), CAGR (%) (2022-2031)
8.1.12 MEA VAN CONVERSION MARKET, BY APPLICATION REVENUE (USD BILLION) (THOUSAND UNITS) (2018-2031), CAGR (%) (2022-2031)
Chapter 9 GLOBAL VAN CONVERSION MARKET: COMPANY PROFILING
9.1 Glampervan
9.1.1 Company Overview
9.1.2 Revenue Analysis (USD Million)
9.1.3 Product Portfolio
9.2 Vanlife Customs
9.2.1 Company Overview
9.2.2 Revenue Analysis (USD Million)
9.2.3 Product Portfolio
9.3 Zenvanz
9.3.1 Company Overview
9.3.2 Revenue Analysis (USD Million)
9.3.3 Product Portfolio
9.4 KISAE
9.4.1 Company Overview
9.4.2 Revenue Analysis (USD Million)
9.4.3 Product Portfolio
9.5 This Moving House
9.5.1 Company Overview
9.5.2 Revenue Analysis (USD Million)
9.5.3 Product Portfolio
9.6 Advanture
9.6.1 Company Overview
9.6.2 Revenue Analysis (USD Million)
9.6.4 SWOT Analysis
9.7 Heartland Road Warrior
9.7.1 Company Overview
9.7.2 Revenue Analysis (USD Million)
9.7.3 Product Portfolio
9.8 Gulf Stream Coach
9.8.1 Company Overview
9.8.2 Revenue Analysis (USD Million)
9.8.3 Product Portfolio
9.9 New Horizons RV
9.9.1 Company Overview
9.9.2 Revenue Analysis (USD Million)
9.9.3 Product Portfolio
9.10 Aluminum Toy Haule
9.10.1 Company Overview
9.10.2 Revenue Analysis (USD Million)
9.10.3 Product Portfolio
9.11 Highland Ridge RV
9.11.1 Company Overview
9.11.2 Revenue Analysis (USD Million)
9.11.3 Product Portfolio
9.11.4 SWOT Analysis
List of Figures
FIG. 1 MARKET SCOPE
FIG. 2 GEOGRAPHIC SCOPE
FIG. 3 YEARS CONSIDERATION
FIG. 4 RESEARCH METHODOLOGY
FIG. 5 SECONDARY RESOURCES
FIG. 6 CONSULTATION WITH KEY OPINION LEADERS/ INDUSTRY EXPERTS
FIG. 7 TOP-DOWN APPROACH
FIG. 8 BOTTOM-UP APPROACH
FIG. 9 DATA TRANGULATION
FIG. 10 DATA TRANGULATION
FIG. 11 GLOBAL VAN CONVERSION MARKET: BY TYPE MARKET SHARE IN 2023
FIG. 12 GLOBAL VAN CONVERSION MARKET: BY APPLICATION MODE MARKET SHARE IN 2023
FIG. 13 COMPETITIVE GRID
FIG. 14 GLOBAL VAN CONVERSION MARKET ATTRACTIVENESS: BY REGION
FIG. 15 GLOBAL VAN CONVERSION MARKET ATTRACTIVENESS: BY TYPE
FIG. 16 GLOBAL VAN CONVERSION MARKET ATTRACTIVENESS: BY APPLICATION
FIG. 17 GLOBAL VAN CONVERSION MARKET SHARE: BY REGION
FIG. 18 GLOBAL VAN CONVERSION MARKET: PORTER’S FIVE FORCES ANALYSIS
FIG. 19 GLOBAL VAN CONVERSION MARKET VALUE (USD BILLION) FOR BASE BUILDS, 2018-2031
FIG. 20 GLOBAL VAN CONVERSION MARKET VOLUME (THOUSAND UNITS) FOR BASE BUILDS, 2018-2031
FIG. 21 GLOBAL VAN CONVERSION MARKET VALUE FOR UPGRADE (USD BILLION), 2018-2031
FIG. 22 GLOBAL VAN CONVERSION MARKET VOLUME (THOUSAND UNITS), 2018-2031
FIG. 23 GLOBAL VAN CONVERSION MARKET VALUE FOR COMMERCIAL USE (USD
BILLION), 2018-2031
FIG. 24 GLOBAL VAN CONVERSION MARKET VOLUME FOR COMMERCIAL USE
(THOUSAND UNITS), 2018-2031
FIG. 25 GLOBAL VAN CONVERSION MARKET VALUE FOR PERSONAL USE (USD
BILLION), 2018-2031
FIG. 26 GLOBAL VAN CONVERSION MARKET VOLUME FOR PERSONAL USE (THOUSAND UNITS), 2018-2031
List of Tables
TABLE 1 GLOBAL VAN CONVERSION MARKET, BY TYPE REVENUE (USD BILLION) (2018-2031), CAGR (%) (2022-2031)
TABLE 2 GLOBAL VAN CONVERSION MARKET, BY TYPE VOLUME (THOUSAND UNITS) (2018-2031), CAGR (%) (2022-2031)
TABLE 3 GLOBAL VAN CONVERSION MARKET, BY APPLICATION REVENUE (USD BILLION) (2018-2031), CAGR (%) (2022-2031)
TABLE 4 GLOBAL VAN CONVERSION MARKET, BY APPLICATION VOLUME (THOUSAND UNITS) (2018-2031), CAGR (%) (2022-2031)
TABLE 5 GLOBAL VAN CONVERSION MARKET, BY REGIONREVENUE (USD BILLION) (2018-2031), CAGR (%) (2022-2031)
TABLE 6 GLOBAL VAN CONVERSION MARKET, BY REGION VOLUME (THOUSAND UNITS) (2018 - 2031), CAGR (%) (2022-2031)
TABLE 7 NORTH AMERICA VAN CONVERSION MARKET, BY COUNTRY REVENUE (USD BILLION) (2018-2031), CAGR (%) (2022-2031)
TABLE 8 NORTH AMERICA VAN CONVERSION MARKET, BY COUNTRY VOLUME (THOUSAND UNITS) (2018-2031), CAGR (%) (2022-2031)
TABLE 9 NORTH AMERICA VAN CONVERSION MARKET, BY TYPE REVENUE (USD BILLION) (2018-2031), CAGR (%) (2022-2031)
TABLE 10 NORTH AMERICA VAN CONVERSION MARKET, BY TYPE VOLUME (THOUSAND UNITS) (2018-2031), CAGR (%) (2022-2031)
TABLE 11 NORTH AMERICA VAN CONVERSION MARKET, BY APPLICATION REVENUE (USD BILLION) (2018-2031), CAGR (%) (2022-2031)
TABLE 12 NORTH AMERICA VAN CONVERSION MARKET, BY APPLICATION VOLUME (THOUSAND UNITS) (2018-2031), CAGR (%) (2022-2031)
TABLE 13 EUROPE VAN CONVERSION MARKET, BY COUNTRY REVENUE (USD BILLION) (2018-2031), CAGR (%) (2022-2031)
TABLE 14 EUROPE VAN CONVERSION MARKET, BY COUNTRY VOLUM (THOUSAND UNITS) (2018-2031), CAGR (%) (2022-2031)
TABLE 15 EUROPE VAN CONVERSION MARKET, BY TYPE REVENUE (USD BILLION) (2018-2031), CAGR (%) (2022-2031)
TABLE 16 EUROPE VAN CONVERSION MARKET, BY TYPE VOLUME (THOUSAND UNITS) (2018-2031), CAGR (%) (2022-2031)
TABLE 17 EUROPE VAN CONVERSION MARKET, BY APPLICATION REVENUE (USD BILLION) (2018-2031), CAGR (%) (2022-2031)
TABLE 18 EUROPE VAN CONVERSION MARKET, BY APPLICATION VOLUME (THOUSAND UNITS) (2018-2031), CAGR (%) (2022-2031)
TABLE 19 APAC VAN CONVERSION MARKET, BY COUNTRY REVENUE (USD BILLION) (2018-2031), CAGR (%) (2022-2031)
TABLE 20 APAC VAN CONVERSION MARKET, BY COUNTRY VOLUME (THOUSAND UNITS) (2018- 2031), CAGR (%) (2022-2031)
TABLE 21 APAC VAN CONVERSION MARKET, BY TYPE REVENUE (USD BILLION) (2018-2031), CAGR (%) (2022-2031)
TABLE 22 APAC VAN CONVERSION MARKET, BY TYPE VOLUME (THOUSAND UNITS) (2018-2031), CAGR (%) (2022-2031)
TABLE 23 APAC VAN CONVERSION MARKET, BY APPLICATION REVENUE (USD BILLION) (2018-2031), CAGR (%) (2022-2031)
TABLE 24 APAC VAN CONVERSION MARKET, BY APPLICATION VOLUME (THOUSAND UNITS) (2018-2031), CAGR (%) (2022-2031)
TABLE 25 SOUTH AMERICA VAN CONVERSION MARKET, BY COUNTRY REVENUE (USD BILLION) (2018-2031), CAGR (%) (2022-2031)
TABLE 26 SOUTH AMERICA VAN CONVERSION MARKET, BY COUNTRY VOLUME (THOUSAND UNITS) (2018-2031), CAGR (%) (2022-2031)
TABLE 27 SOUTH AMERICA VAN CONVERSION MARKET, BY TYPE REVENUE (USD BILLION) (2018-2031), CAGR (%) (2022-2031)
TABLE 28 SOUTH AMERICA VAN CONVERSION MARKET, BY TYPE VOLUME (THOUSAND UNITS) (2018-2031), CAGR (%) (2022-2031)
TABLE 29 SOUTH AMERICA VAN CONVERSION MARKET, BY APPLICATION REVENUE (USD BILLION) (2018-2031), CAGR (%) (2022-2031)
TABLE 30 SOUTH AMERICA VAN CONVERSION MARKET, BY APPLICATION VOLUME (THOUSAND UNITS) (2018-2031), CAGR (%) (2022-2031)
TABLE 31 MEA VAN CONVERSION MARKET, BY COUNTRY REVENUE (USD BILLION) (2018-2031), CAGR (%) (2022-2031)
TABLE 32 MEA VAN CONVERSION MARKET, BY COUNTRY VOLUME (THOUSAND UNITS) (2018-2031), CAGR (%) (2022-2031)
TABLE 33 MEA VAN CONVERSION MARKET, BY TYPE REVENUE (USD BILLION) (2018-2031), CAGR (%) (2022-2031)
TABLE 34 MEA VAN CONVERSION MARKET, BY TYPE VOLUME (THOUSAND UNITS) (2018-2031), CAGR (%) (2022-2031)
TABLE 35 MEA VAN CONVERSION MARKET, BY APPLICATION REVENUE (USD BILLION) (2018-2031), CAGR (%) (2022-2031)
TABLE 36 MEA VAN CONVERSION MARKET, BY APPLICATION VOLUME (THOUSAND UNITS) (2018-2031), CAGR (%) (2022-2031)
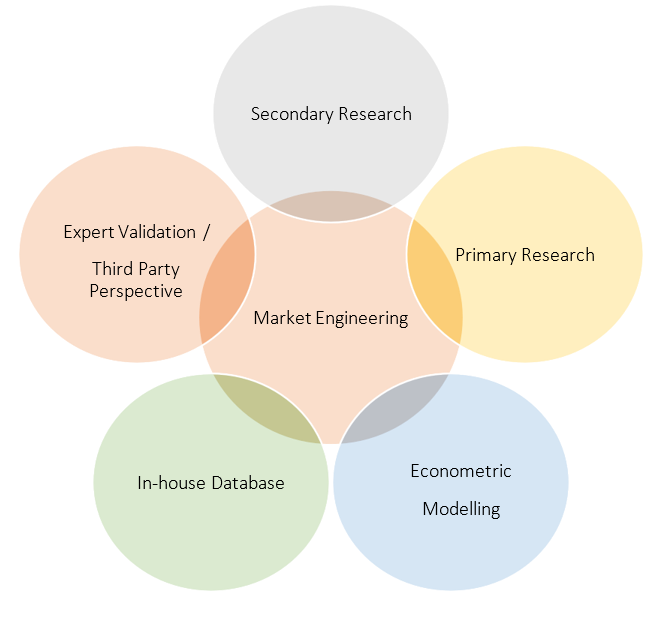
Research Methodology
Our research methodology has always been the key differentiating reason which sets us apart in comparison from the competing organizations in the industry. Our organization believes in consistency along with quality and establishing a new level with every new report we generate; our methods are acclaimed and the data/information inside the report is coveted. Our research methodology involves a combination of primary and secondary research methods. Data procurement is one of the most extensive stages in our research process. Our organization helps in assisting the clients to find the opportunities by examining the market across the globe coupled with providing economic statistics for each and every region. The reports generated and published are based on primary & secondary research. In secondary research, we gather data for global Market through white papers, case studies, blogs, reference customers, news, articles, press releases, white papers, and research studies. We also have our paid data applications which includes hoovers, Bloomberg business week, Avention, and others.
Data Collection
Data collection is the process of gathering, measuring, and analyzing accurate and relevant data from a variety of sources to analyze market and forecast trends. Raw market data is obtained on a broad front. Data is continuously extracted and filtered to ensure only validated and authenticated sources are considered. Data is mined from a varied host of sources including secondary and primary sources.
Primary Research
After the secondary research process, we initiate the primary research phase in which we interact with companies operating within the market space. We interact with related industries to understand the factors that can drive or hamper a market. Exhaustive primary interviews are conducted. Various sources from both the supply and demand sides are interviewed to obtain qualitative and quantitative information for a report which includes suppliers, product providers, domain experts, CEOs, vice presidents, marketing & sales directors, Type & innovation directors, and related key executives from various key companies to ensure a holistic and unbiased picture of the market.
Secondary Research
A secondary research process is conducted to identify and collect information useful for the extensive, technical, market-oriented, and comprehensive study of the market. Secondary sources include published market studies, competitive information, white papers, analyst reports, government agencies, industry and trade associations, media sources, chambers of commerce, newsletters, trade publications, magazines, Bloomberg BusinessWeek, Factiva, D&B, annual reports, company house documents, investor presentations, articles, journals, blogs, and SEC filings of companies, newspapers, and so on. We have assigned weights to these parameters and quantified their market impacts using the weighted average analysis to derive the expected market growth rate.
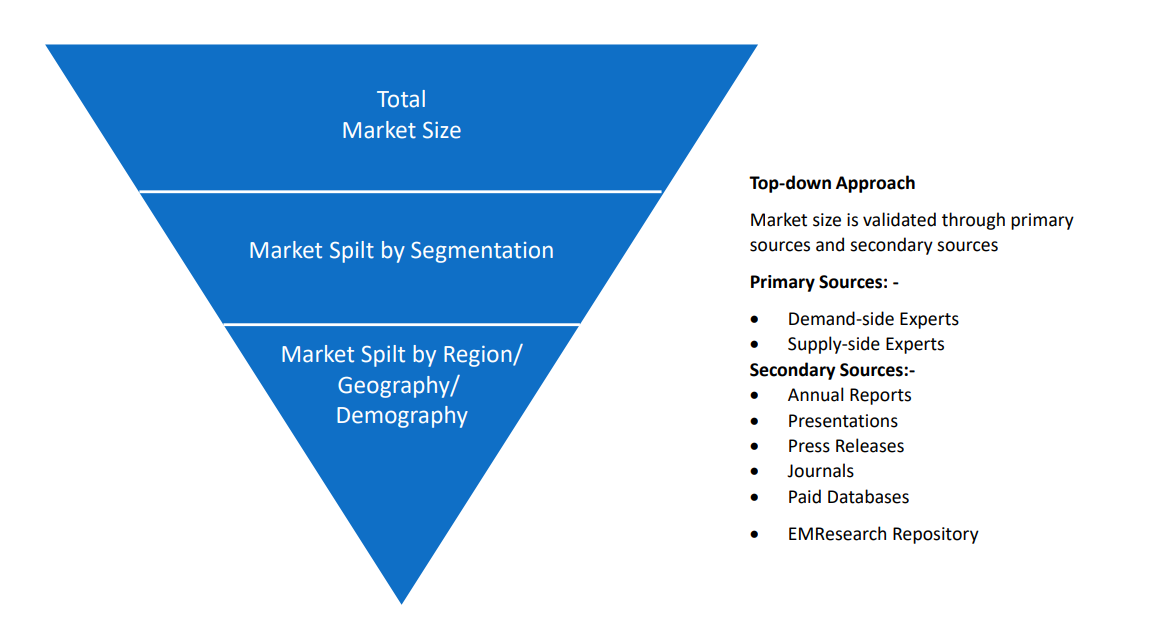
Top-Down Approach & Bottom-Up Approach
In the top – down approach, the Global Batteries for Solar Energy Storage Market was further divided into various segments on the basis of the percentage share of each segment. This approach helped in arriving at the market size of each segment globally. The segments market size was further broken down in the regional market size of each segment and sub-segments. The sub-segments were further broken down to country level market. The market size arrived using this approach was then crosschecked with the market size arrived by using bottom-up approach.
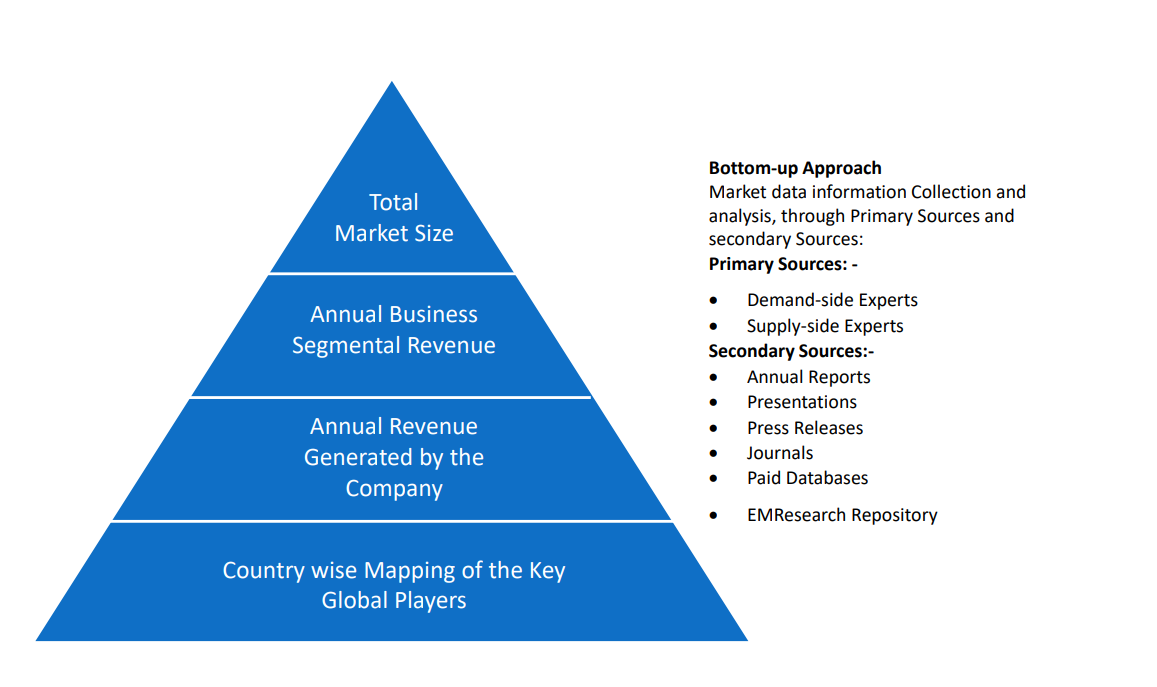
In the bottom-up approach, we arrived at the country market size by identifying the revenues and market shares of the key market players. The country market sizes then were added up to arrive at regional market size of the decorated apparel, which eventually added up to arrive at global market size.
This is one of the most reliable methods as the information is directly obtained from the key players in the market and is based on the primary interviews from the key opinion leaders associated with the firms considered in the research. Furthermore, the data obtained from the company sources and the primary respondents was validated through secondary sources including government publications and Bloomberg.
Market Analysis & size Estimation
Post the data mining stage, we gather our findings and analyze them, filtering out relevant insights. These are evaluated across research teams and industry experts. All this data is collected and evaluated by our analysts. The key players in the industry or markets are identified through extensive primary and secondary research. All percentage share splits, and breakdowns have been determined using secondary sources and verified through primary sources. The market size, in terms of value and volume, is determined through primary and secondary research processes, and forecasting models including the time series model, econometric model, judgmental forecasting model, the Delphi method, among Flywheel Energy Storage. Gathered information for market analysis, competitive landscape, growth trends, product development, and pricing trends is fed into the model and analyzed simultaneously.
Quality Checking & Final Review
The analysis done by the research team is further reviewed to check for the accuracy of the data provided to ensure the clients’ requirements. This approach provides essential checks and balances which facilitate the production of quality data. This Type of revision was done in two phases for the authenticity of the data and negligible errors in the report. After quality checking, the report is reviewed to look after the presentation, Type and to recheck if all the requirements of the clients were addressed.