US Trading Cards Market Size, Share, Growth, Trends, Analysis, By Type (Sports Trading Cards, Non-Sports Trading Cards, Other Trading Cards), By Distribution Channels (Online and Offline), By Application (Collectible, Competitive Gaming, Investment) and Regional Insights and Forecast to 2032
US trading cards market size was USD 2.10 billion in 2023 and is predicted to reach USD 3.21 billion in 2032, exhibiting at a CAGR of 4.8% during the forecast period
The collectible cards with sports, entertainment, and gaming themes are the focal point of the thriving US trading card market. From its beginnings in the late 1800s, the market has grown to be valued at billions of dollars. Major sports leagues like the NFL, NBA, and MLB as well as entertainment brands like Pokémon and Magic: The Gathering are important participants. There is a thriving secondary market because collectors value cards according to factors including condition, rarity, and player or character significance. Its reach has been further increased by the emergence of digital trading cards and online venues.
US TRADING CARDS MARKET: REPORT SCOPE & SEGMENTATION
|
Report Attribute |
Details |
|
Estimated Market Value (2023) |
2.10 Bn |
|
Projected Market Value (2032) |
3.21 Bn |
|
Base Year |
2023 |
|
Forecast Years |
2024 - 2032 |
|
Scope of the Report |
Historical and Forecast Trends, Industry Drivers and Constraints, Historical and Forecast Market Analysis by Segment- By Type, By Distribution Channels, By Application, & Region |
|
Segments Covered |
By Type, By Distribution Channels, By Application, & Region |
|
Forecast Units |
Value (USD Billion or Million), and Volume (Units) |
|
Quantitative Units |
Revenue in USD million/billion and CAGR from 2024 to 2032 |
|
Countries Covered |
U.S., Canada, and Mexico |
|
Report Coverage |
Market growth drivers, restraints, opportunities, Porter’s five forces analysis, PEST analysis, value chain analysis, regulatory landscape, market attractiveness analysis by segments and region, company market share analysis, and COVID-19 impact analysis. |
|
Delivery Format |
Delivered as an attached PDF and Excel through email, according to the purchase option. |
US Trading Cards Dynamics
The popularity of cards is driven by trends in player transfers, sports performance, and cultural occurrences. Scarcity tactics and limited-edition releases stimulate collector demand, which frequently results in speculative trading and price swings. Standards for validity and ownership are being redefined by technological developments like blockchain integration and digital card systems. Market activity is boosted by occasions like player milestones, movie launches, and tournaments. Consumer behavior is also impacted by social media trends, economic conditions, and regulatory changes. In general, the market depends on a precarious equilibrium between supply, demand, and cultural significance, and it is always changing in reaction to many factors.
US Trading Cards Drivers
The demand for cards portraying these sportsmen has surged due to their remarkable performances, unprecedented accomplishments, and developing potential, which capture the attention of collectors. Popularity of cards is further shaped by player transfers, team accomplishments, and individual awards. Sports are dynamic, so new stories and narratives are always coming up. This keeps the market fresh and exciting as fans try to recreate the thrill and nostalgia of these special moments in trading cards.
The US trading card business is heavily influenced by cultural phenomena and entertainment franchises that capitalize on the ardent following around beloved characters, motion pictures, and television series. The desire for themed trading cards is fueled by popular brands that have captivated collectors for years, such as Star Wars, Marvel, and Pokémon. The market reacts with heightened enthusiasm to these franchises when they develop and release new material, such as video game expansions or movie sequels, which drives sales and cultivates a thriving community of collectors eager to honor their favorite cultural touchstones through trading cards.
Restraints:
The US trading card sector is severely hampered by counterfeit goods, which erode customer confidence. The widespread availability of fake cards reduces the value of real collections and threatens the industry's credibility as a whole. As collectors look for guarantees regarding the authenticity and provenance of their acquisitions, authentication concerns surface. These obstacles prevent the market from expanding by deterring potential collectors and making current ones more circumspect, which affects sales and the stability of the industry as a whole.
The traditional US trading card sector is under significant challenges from competition from digital and internet platforms. The appeal of virtual cards, online trading platforms, and digital card games detracts from actual trading cards as consumers increasingly resort to digital formats for collectors and amusement. Traditional cards can't match the ease of use, accessibility, and immersive experiences provided by these digital substitutes. As a result, in an increasingly digital environment, the traditional market is under pressure to innovate and adapt.
Opportunities:
The US trading card business has a great chance to attract collectors and improve their experience through innovative card design and technology integration. Modern printing methods, augmented reality capabilities, and interactive components can revitalize conventional cards and create one-of-a-kind, immersive experiences. Authenticity and value are increased by utilizing NFC or QR code technology for additional content access and authentication. These developments drive sales and market expansion by drawing in new collectors as well as rekindling enthusiasm among seasoned fans.
The US trading card industry has a tremendous chance to transform collector engagement through the use of augmented reality (AR) and interactive elements. Through the use of augmented reality (AR) technology, collectors may enhance the card-collecting experience by unlocking immersive experiences like player statistics, animated visuals, or exclusive movies by superimposing digital content onto physical cards. In addition to giving traditional cards excitement and complexity, this interactive element draws in tech-savvy consumers, broadening the market's appeal and promoting a more dynamic and engaging collecting experience.
Segment Overview
Based on type, the US trading cards market is divided into sports trading cards, non-sports trading cards, and other trading cards. The sports trading cards category dominates the market with the largest revenue share in 2023. Athletes from the NFL, NBA, MLB, NHL, and other sports leagues are featured on these cards. They frequently feature athlete stats, accomplishments, and significant occasions in sports history. Sports fans and collectors who want to honor their favorite players and teams are big fans of sports trading cards. Beyond sports, non-sports trading cards feature a broad range of themes, such as pop culture icons, TV series, comic books, movies, and video games. Popular properties like Star Wars, Marvel, Pokémon, Harry Potter, and more are represented on these cards through characters, scenes, artwork, and information. Collectors interested in entertainment and cultural items find attraction in non-sports trading cards.
Based on the distribution channels, the US trading cards market is categorized into online and offline. The online category leads the US trading cards market with the largest revenue share in 2023. The selling and distribution of trading cards via digital platforms and e-commerce websites are referred to as online distribution channels. This covers specialized online markets, auction websites, official brand websites, and independent merchants running virtual storefronts. The selling of trading cards through physical retail stores, specialized shops, hobby stores, sports memorabilia stores, and other brick-and-mortar institutions is known as an offline distribution channel. Customers can explore and buy trading cards straight from these physical businesses.
Based on application, the US trading cards market is divided into collectible, competitive gaming, and investment. The competitive gaming category dominates the market with the largest revenue share in 2023. Trading cards are the main feature of the competitive gaming market. They are utilized in planned tournaments or strategic gameplay. Playing trading card games (TCGs) such as Yu-Gi-Oh!, Pokémon TCG, and Magic: The Gathering include players building decks of cards with special abilities and competing against other players or in multiplayer matches. In the US trading card market, cards that are primarily purchased for their sentimental or nostalgic value fall into the collector category. Cards with the images of sports teams, athletes, movie studios, or pop culture celebrities are sought for by collectors. The trading cards that are the subject of the investing section are thought of as financial assets that have the potential to increase in value over time.
US Trading Cards Overview by Region
The US trading cards market is categorized into U.S., Canada, and Mexico. The U.S. emerged as the leading region, capturing the largest market share in 2023. The United States has a huge market for sports trading cards because of its rich sporting history and passionate fan base, which spans multiple sports leagues like the NFL, NBA, MLB, and NHL. Furthermore, the nation is home to a number of well-known entertainment franchises, such as Marvel, Star Wars, and Pokémon, which contribute significantly to sales in the non-sports trading card market. The United States is a prominent force in the trading card business because to its strong infrastructure of retail distribution channels, online platforms, and devoted collector communities.
Throughout the forecast period, Canada is anticipated to post a significant CAGR. A number of variables, such as expanding levels of disposable income, growing numbers of collectors, and increased engagement in sports and gaming activities, are responsible for this expected expansion. The market is steadily growing as more and more Canadians adopt trading cards in a variety of sectors, such as sports, entertainment, and gaming. Furthermore, the market's growth trajectory in Canada is bolstered by developments in digital trading card efforts and online retail platforms, indicating the region's potential for sustained market expansion in the years to come.
US Trading Cards Competitive Landscape
In the US trading cards market, a few major players exert significant market dominance and have established a strong regional presence. These leading companies remain committed to continuous research and development endeavors and actively engage in strategic growth initiatives, including product development, launches, joint ventures, and partnerships. By pursuing these strategies, these companies aim to strengthen their market position, expand their customer base, and capture a substantial share of the market.
Some of the prominent players in the US trading cards market include,
US Trading Cards Recent Developments
Scope of the US Trading Cards Report
US Trading Cards Market Report Segmentation
|
ATTRIBUTE |
DETAILS |
|
By Type |
|
|
By Distribution Channels |
|
|
By Application |
|
|
By Geography |
|
|
Customization Scope |
|
|
Pricing |
|
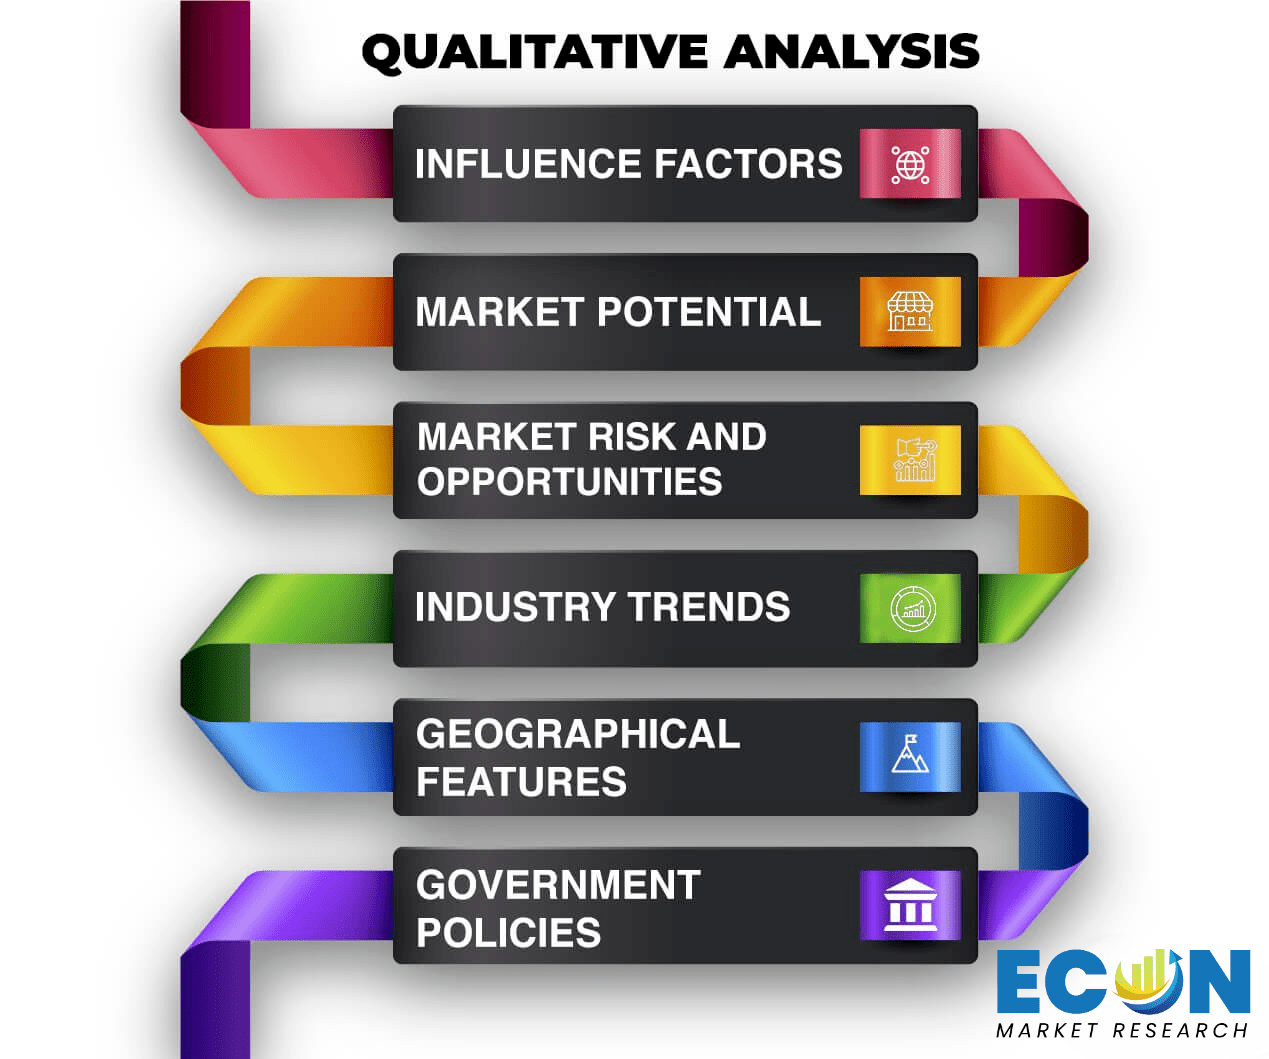
Objectives of the Study
The objectives of the study are summarized in 5 stages. They are as mentioned below:
Intended Audience
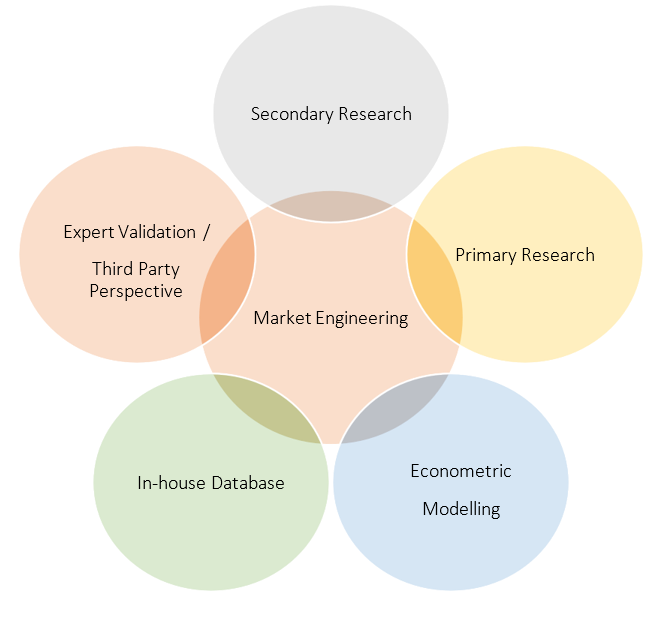
Research Methodology
Our research methodology has always been the key differentiating reason which sets us apart in comparison from the competing organizations in the industry. Our organization believes in consistency along with quality and establishing a new level with every new report we generate; our methods are acclaimed and the data/information inside the report is coveted. Our research methodology involves a combination of primary and secondary research methods. Data procurement is one of the most extensive stages in our research process. Our organization helps in assisting the clients to find the opportunities by examining the market across the globe coupled with providing economic statistics for each and every region. The reports generated and published are based on primary & secondary research. In secondary research, we gather data for global Market through white papers, case studies, blogs, reference customers, news, articles, press releases, white papers, and research studies. We also have our paid data applications which includes hoovers, Bloomberg business week, Avention, and others.
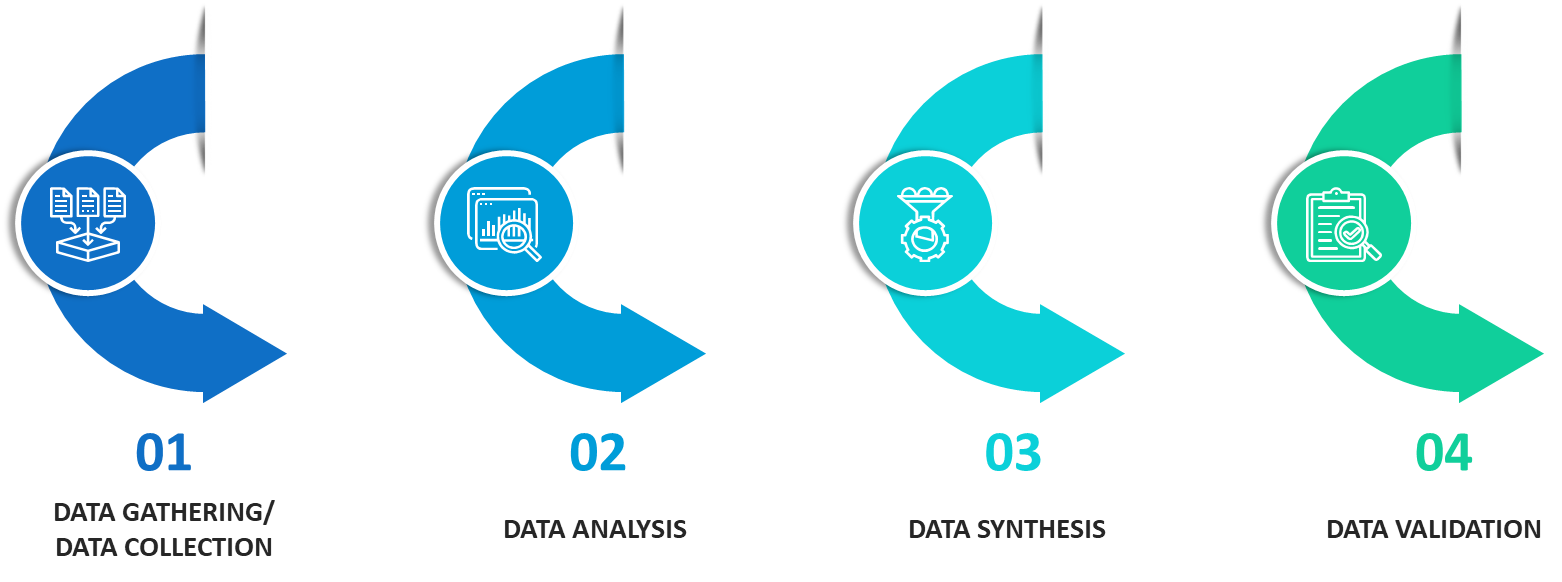
Data Collection
Data collection is the process of gathering, measuring, and analyzing accurate and relevant data from a variety of sources to analyze market and forecast trends. Raw market data is obtained on a broad front. Data is continuously extracted and filtered to ensure only validated and authenticated sources are considered. Data is mined from a varied host of sources including secondary and primary sources.
Primary Research
After the secondary research process, we initiate the primary research phase in which we interact with companies operating within the market space. We interact with related industries to understand the factors that can drive or hamper a market. Exhaustive primary interviews are conducted. Various sources from both the supply and demand sides are interviewed to obtain qualitative and quantitative information for a report which includes suppliers, product providers, domain experts, CEOs, vice presidents, marketing & sales directors, Type & innovation directors, and related key executives from various key companies to ensure a holistic and unbiased picture of the market.
Secondary Research
A secondary research process is conducted to identify and collect information useful for the extensive, technical, market-oriented, and comprehensive study of the market. Secondary sources include published market studies, competitive information, white papers, analyst reports, government agencies, industry and trade associations, media sources, chambers of commerce, newsletters, trade publications, magazines, Bloomberg BusinessWeek, Factiva, D&B, annual reports, company house documents, investor presentations, articles, journals, blogs, and SEC filings of companies, newspapers, and so on. We have assigned weights to these parameters and quantified their market impacts using the weighted average analysis to derive the expected market growth rate.
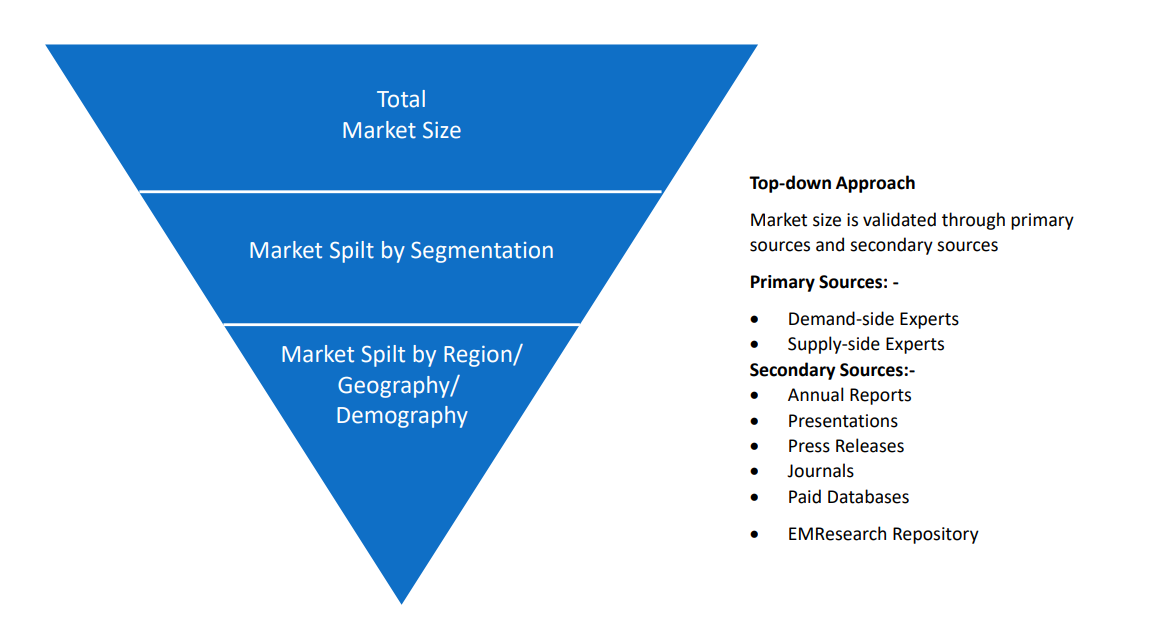
Top-Down Approach & Bottom-Up Approach
In the top – down approach, the Global Batteries for Solar Energy Storage Market was further divided into various segments on the basis of the percentage share of each segment. This approach helped in arriving at the market size of each segment globally. The segments market size was further broken down in the regional market size of each segment and sub-segments. The sub-segments were further broken down to country level market. The market size arrived using this approach was then crosschecked with the market size arrived by using bottom-up approach.
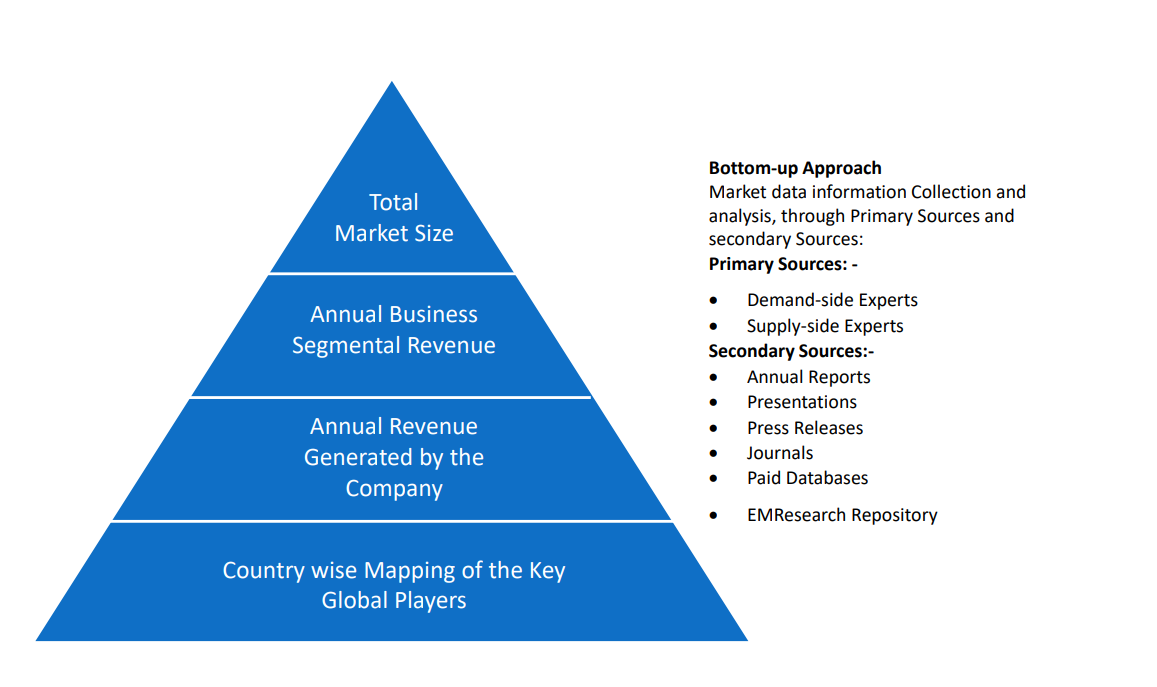
In the bottom-up approach, we arrived at the country market size by identifying the revenues and market shares of the key market players. The country market sizes then were added up to arrive at regional market size of the decorated apparel, which eventually added up to arrive at global market size.
This is one of the most reliable methods as the information is directly obtained from the key players in the market and is based on the primary interviews from the key opinion leaders associated with the firms considered in the research. Furthermore, the data obtained from the company sources and the primary respondents was validated through secondary sources including government publications and Bloomberg.
Market Analysis & size Estimation
Post the data mining stage, we gather our findings and analyze them, filtering out relevant insights. These are evaluated across research teams and industry experts. All this data is collected and evaluated by our analysts. The key players in the industry or markets are identified through extensive primary and secondary research. All percentage share splits, and breakdowns have been determined using secondary sources and verified through primary sources. The market size, in terms of value and volume, is determined through primary and secondary research processes, and forecasting models including the time series model, econometric model, judgmental forecasting model, the Delphi method, among Flywheel Energy Storage. Gathered information for market analysis, competitive landscape, growth trends, product development, and pricing trends is fed into the model and analyzed simultaneously.
Quality Checking & Final Review
The analysis done by the research team is further reviewed to check for the accuracy of the data provided to ensure the clients’ requirements. This approach provides essential checks and balances which facilitate the production of quality data. This Type of revision was done in two phases for the authenticity of the data and negligible errors in the report. After quality checking, the report is reviewed to look after the presentation, Type and to recheck if all the requirements of the clients were addressed.