Global Interactive Display Market Research Report: By Panel Type (Flat Panel, Flexible Panel, and Transparent Panel), By Technology (OLED, LED, LCD, and QD) By Application (Interactive Table, Interactive Monitor, Interactive Kiosk, Interactive Whiteboard, and Video Wall), By End User (Healthcare, Retail, BFSI, Military & Defense, Transportation, Education, and Other), and Region (North America, Europe, Asia-Pacific, and Rest of the World) Global Industry Analysis, Size, Share, Growth, Trends, Regional Analysis, Competitor Analysis and Forecast 2023-2031.
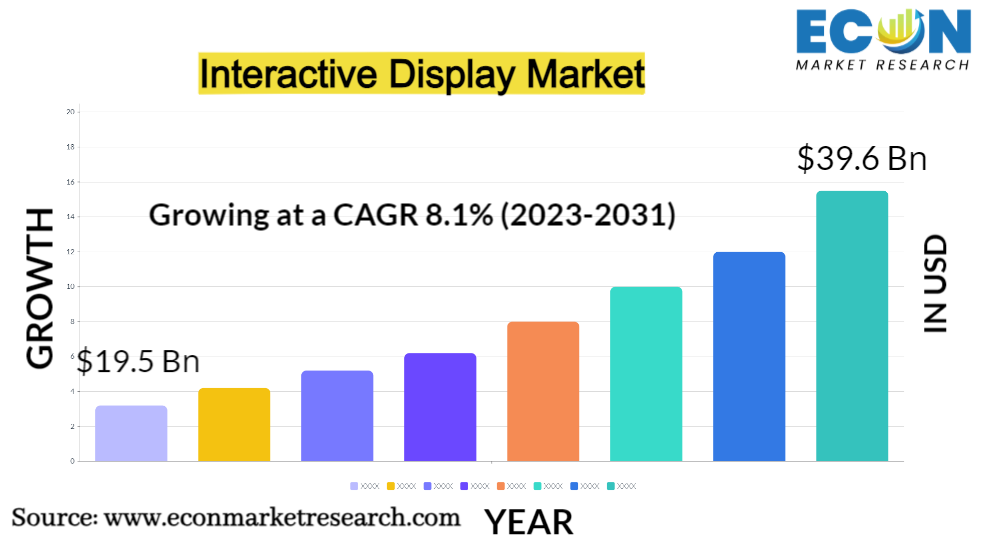
The Global Interactive Display Market was valued at USD 19.5 billion in 2022 and is estimated to reach approximately USD 39.6 billion by 2031, at a CAGR of 8.1% from 2023 to 2031. An interactive display refers to a technological interface that enables user engagement and input through touch, gestures, or other interactive methods. Unlike traditional displays, which primarily provide visual output, interactive displays allow users to actively interact with digital content displayed on the screen. These displays are equipped with touch-sensitive surfaces, sensors, and software that interpret user actions, such as tapping, swiping, pinching, and dragging. This interaction can involve various applications, from educational tools and presentations to gaming and digital signage. Interactive displays find applications across diverse sectors, including education, business, entertainment, and public spaces. The interactive display market has witnessed remarkable growth due to the increasing demand for engaging and immersive user experiences across various sectors. Interactive displays have revolutionized the way information is presented and consumed, combining visual content with touch, gestures, and interactive capabilities. The market includes a wide range of products, including interactive whiteboards, touchscreens, kiosks, and interactive monitors, all of which are driven by advances in touch technology. These displays find applications in education, where they enhance classroom learning through dynamic and collaborative experiences. In the corporate world, interactive displays facilitate more interactive presentations, video conferences, and brainstorming sessions. As technology evolves, the market continues to innovate, incorporating features like augmented reality (AR) and virtual reality (VR) to create even more immersive interactions. With a growing emphasis on digital engagement, the interactive display market is poised to expand further as businesses and industries seek innovative ways to capture and retain audience attention in an increasingly digital world. The entertainment and retail sectors have also embraced interactive displays to create captivating digital experiences for customers, improving brand engagement and information dissemination. Moreover, the healthcare industry employs interactive displays for patient education and medical imaging, while public spaces like museums and transportation hubs utilize them to convey information in an engaging manner.
INTERACTIVE DISPLAY MARKET: REPORT SCOPE & SEGMENTATION
|
Report Attribute |
Details |
|
Estimated Market Value (2022) |
19.5 Bn |
|
Projected Market Value (2031) |
39.6 Bn |
|
Base Year |
2022 |
|
Forecast Years |
2023 - 2031 |
|
Scope of the Report |
Historical and Forecast Trends, Industry Drivers and Constraints, Historical and Forecast Market Analysis by Segment- By Panel Type, By Application, By Technology, By End User, & Region |
|
Segments Covered |
By Panel Type, By Application, By Technology, By End User, & Region |
|
Forecast Units |
Value (USD Billion or Million), and Volume (Units) |
|
Quantitative Units |
Revenue in USD million/billion and CAGR from 2023 to 2031 |
|
Regions Covered |
North America, Europe, Asia Pacific, Latin America, and Middle East & Africa, and the Rest of World |
|
Countries Covered |
U.S., Canada, Mexico, U.K., Germany, France, Italy, Spain, China, India, Japan, South Korea, Brazil, Argentina, GCC Countries, and South Africa, among others |
|
Report Coverage |
Market growth drivers, restraints, opportunities, Porter’s five forces analysis, PEST analysis, value chain analysis, regulatory landscape, market attractiveness analysis by segments and region, company market share analysis, and COVID-19 impact analysis. |
|
Delivery Format |
Delivered as an attached PDF and Excel through email, according to the purchase option. |
Global Interactive Display Market Dynamics
The interactive display market is characterized by dynamic forces that shape its growth and evolution. Advancements in technology, particularly in touch sensitivity and display quality, play a pivotal role. The rising demand for engaging user experiences across education, corporate, retail, entertainment, and healthcare sectors drives market expansion. The education sector propels the market as interactive displays transform traditional classrooms into interactive learning hubs, fostering collaboration and knowledge retention. In the corporate realm, these displays enable seamless presentations, fostering efficient communication and idea sharing. The entertainment and retail industries leverage interactive displays to captivate audiences, enhance brand interaction, and drive sales. Moreover, the healthcare sector employs interactive displays for patient education and diagnostic purposes, bolstering market growth. Public spaces utilize these displays for informative and interactive experiences. Emerging technologies like augmented reality (AR) and virtual reality (VR) are reshaping the market by introducing more immersive interactions. However, challenges like high costs, technical complexities, and security concerns can hinder growth. Competition among manufacturers and the need for differentiated offerings also influence market dynamics. Global trends, such as the shift towards remote work and digital communication, further stimulate market demand. The interactive display market's trajectory depends on its ability to adapt to technological advancements, cater to diverse industry needs, and provide solutions that enrich user engagement across sectors.
Global Interactive Display Market Drivers
The growing digital transformation is a significant driver propelling the interactive display market forward. As industries across the spectrum undergo a fundamental shift towards digitization, the role of interactive displays becomes increasingly vital. In this context, interactive displays serve as a bridge between traditional communication methods and the evolving digital landscape. Industries are recognizing the need to adapt their communication strategies to suit modern preferences and habits. Consumers, employees, and students are more accustomed to engaging with digital content, making interactive displays a natural fit for conveying information effectively. These displays enable the seamless integration of digital media, interactive elements, and real-time updates, enhancing communication and engagement.
In an era saturated with digital content, capturing and sustaining user attention is paramount. Interactive displays address this challenge by introducing a more dynamic and participatory dimension to content consumption. Traditional displays, while informative, often lack the interactivity needed to fully engage modern audiences. Interactive displays change this dynamic by enabling users to directly interact with the content on the screen through touch, gestures, and sometimes even voice commands. This direct engagement transforms passive observers into active participants, resulting in deeper involvement and increased information retention. The inherent human inclination to interact with the environment is harnessed by interactive displays, making them compelling tools for enhancing user engagement.
Restraints:
These displays offer a host of benefits, but the upfront investment required can be a deterrent for many potential users, particularly smaller businesses and educational institutions with limited financial resources. Interactive display solutions encompass not only the cost of the display hardware itself but also associated expenses such as software licenses, installation, and possibly additional infrastructure upgrades. These combined expenses can strain budgets, leading decision-makers to opt for more conventional and cost-effective alternatives.
The installation process involves not only physically mounting the display but also calibrating touch sensitivity, integrating software, and ensuring seamless connectivity with existing systems. This complexity demands technical expertise that may not be readily available within every organization. As a result, deployment can be time-consuming, leading to delays and potential disruptions in operations. Furthermore, maintaining interactive displays involves continuous monitoring, software updates, and troubleshooting to ensure their optimal performance. Organizations need dedicated IT resources to address technical glitches, connectivity issues, and software conflicts that may arise over time. Without proper maintenance, interactive displays might experience downtime, diminishing their value and potentially frustrating users.
Opportunities:
Interactive displays address a common challenge in healthcare: conveying complex medical information to patients in a clear and understandable manner. Medical jargon and intricate procedures can be overwhelming for patients. Interactive displays provide a visual and interactive platform that simplifies medical concepts, making it easier for healthcare professionals to explain diagnoses, treatment options, and procedures. Patients can engage with the content, ask questions, and have a better understanding of their health conditions, leading to more informed decision-making and improved compliance with treatment plans. Moreover, interactive displays have applications in medical imaging interpretation. Radiologists and other medical professionals can use touch-enabled displays to interact directly with medical images, annotate findings, and collaborate with colleagues. This dynamic interaction enhances accuracy in diagnosing conditions and planning treatments, ultimately leading to better patient outcomes.
Interactive displays have the potential to reshape the gaming experience by introducing new levels of immersion and engagement. Players can directly interact with the game world through touch, gestures, and even body movements. This technology opens doors to innovative gameplay mechanics, augmented reality experiences, and virtual reality integration, enhancing player involvement and enjoyment. In live events such as concerts, festivals, and exhibitions, interactive displays can enable attendees to actively participate in the experience. These displays can facilitate audience engagement by allowing users to control visual effects, vote on aspects of the event, or even interact with performers in unique ways, blurring the lines between the stage and the audience.
Segment Overview
By Panel Type
Based on panel type, the global interactive display market is divided into flat panels, flexible panels, and transparent panels. The flexible panel category dominates the market with the largest revenue share. Flexible panels introduce a new level of versatility to interactive displays. These panels are made from flexible materials that can be bent or curved to fit unconventional shapes or spaces. Flexible displays offer opportunities for creative installations, unique designs, and adaptive solutions. They are particularly valuable in environments where curved surfaces are desirable, such as curved video walls, curved signage, or unconventional architectural designs. Flexible panels can enhance aesthetic appeal and enable innovative applications in retail, exhibitions, and architectural integration.
By Technology
Based on the technology, the global interactive display market is categorized into OLED, LED, LCD, and QD. The LCD category leads the global interactive display market with the largest revenue share. LCD displays use liquid crystal technology to modulate light and create images on the screen. These displays offer a balance between image quality, cost-effectiveness, and versatility. LCDs are commonly found in various applications, including computer monitors, television screens, and interactive whiteboards. They come in various resolutions and sizes, making them adaptable to a wide range of uses. Where LED displays consist of an array of light-emitting diodes that emit light when an electric current flows through them. LED technology is commonly used in large-format displays, such as LED video walls and digital signage. These displays offer high brightness levels, making them suitable for outdoor and well-lit indoor environments. Similarly, OLED displays utilize organic compounds that emit light when an electric current is applied. These displays offer high contrast ratios, vibrant colors, and wide viewing angles.
By Application
Based on application, the global interactive display market is segmented into interactive tables, interactive monitors, interactive kiosks, interactive whiteboards, and video walls. The interactive kiosk segment dominates the interactive display market. Interactive kiosks are self-contained units equipped with touch-enabled displays. They provide information, services, or product details to users in public spaces such as malls, airports, and information centers. Interactive kiosks enable users to navigate through options, select preferences, and gather information in a user-friendly manner. where the market share for interactive whiteboards is the second-largest. Interactive whiteboards combine traditional whiteboard functionality with interactive technology. They are often used in educational and corporate settings for presentations, collaborative discussions, and interactive lessons. Users can write, draw, and manipulate digital content on the board's surface.
By End User
Based on the end user, the global interactive display market is categorized into healthcare, retail, BFSI, military & defense, transportation, education, and others. The education category leads the global interactive display market with the largest revenue share. Interactive displays play a pivotal role in educational settings, transforming classrooms with interactive whiteboards, interactive tables, and collaborative learning tools. These displays enhance student engagement, learning outcomes, and educator effectiveness. Similarly, In the BFSI sector, interactive displays are employed for self-service kiosks, digital signage, and customer engagement. Interactive displays enhance the customer experience by providing information on financial products, services, and real-time market data. The retail industry leverages interactive displays for interactive product demonstrations, virtual try-ons, interactive catalogs, and enhanced customer engagement. These displays create immersive shopping experiences that help drive sales and brand loyalty. Also, interactive displays are extensively used in the healthcare sector for applications such as patient education, medical imaging interpretation, diagnostic presentations, and telemedicine. These displays enhance communication between healthcare professionals and patients and contribute to more informed decision-making.
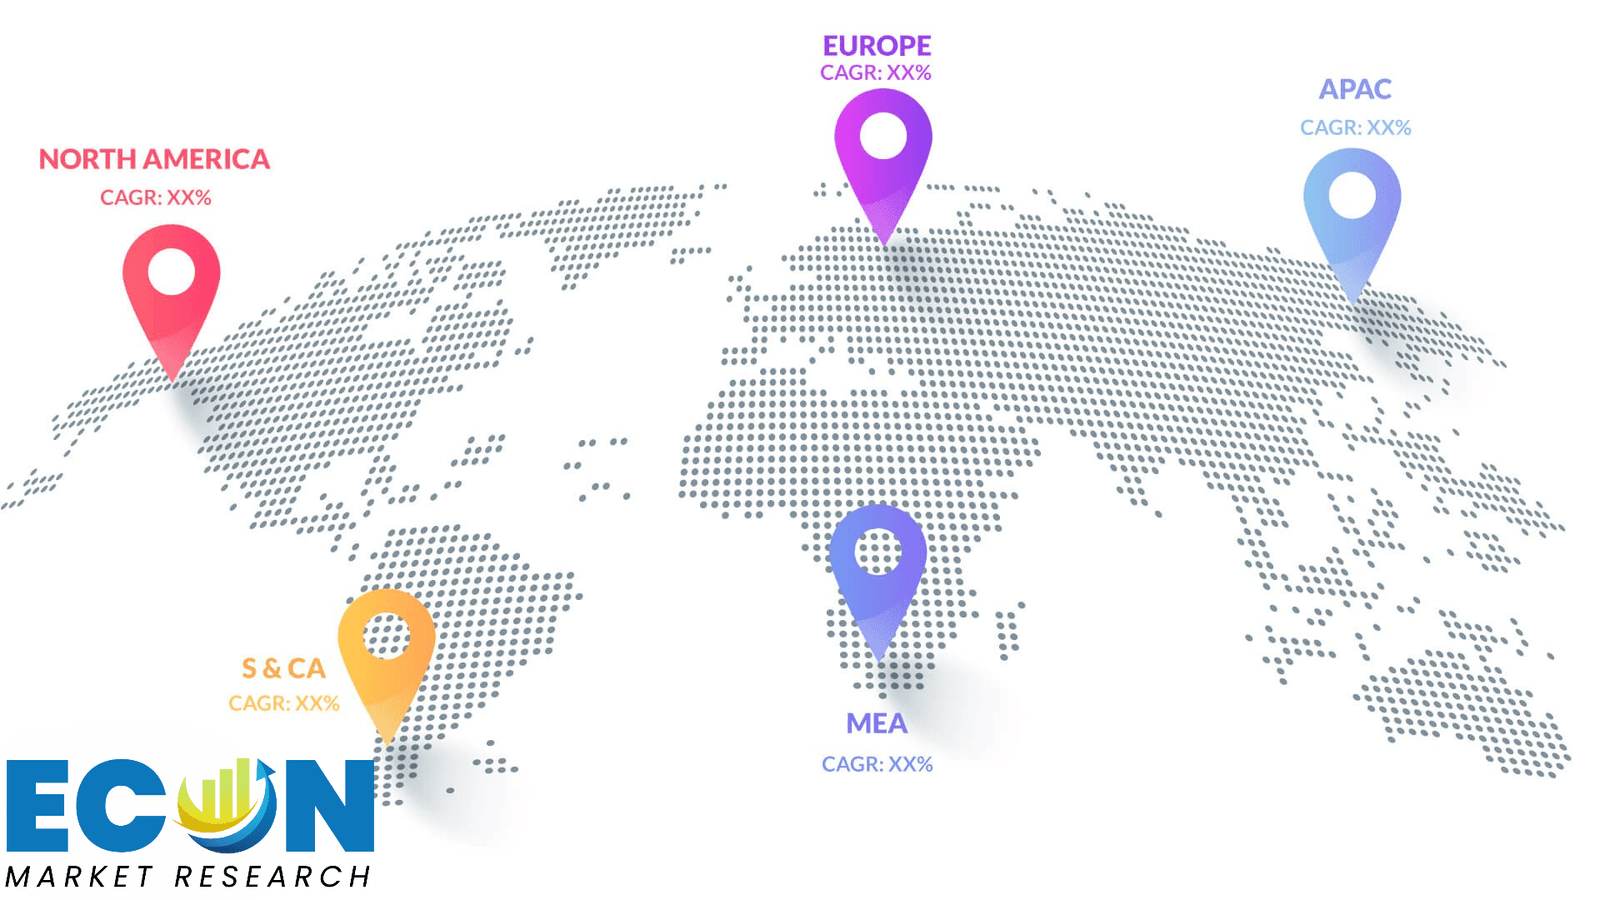
Global Interactive Display Market Overview by Region
The global interactive display market is categorized into North America, Europe, Asia-Pacific, and the Rest of the World. Europe emerged as the leading region, capturing the largest market share. Europe boasts a robust technological infrastructure that supports the integration and implementation of interactive display solutions. The region's well-developed connectivity, high-speed internet access, and advanced telecommunications networks provide a solid foundation for the deployment of interactive technologies. Europe places a strong emphasis on education and innovation, driving the adoption of interactive displays in both educational institutions and corporate settings. Interactive displays have revolutionized classrooms, enhancing learning experiences, while also being embraced by businesses for presentations, collaboration, and communication. Europe's diverse languages and cultures have driven the adoption of interactive displays for multilingual communication and engagement. Interactive displays offer a dynamic way to convey information in multiple languages and cater to the diverse needs of European populations. Europe's leadership in the interactive display market highlights its technological prowess, commitment to education and innovation, and its ability to leverage these technologies to enhance various aspects of society. As the region continues to invest in and embrace interactive display solutions, its influence on the global market is likely to continue.
Global Interactive Display Market Competitive Landscape
In the global interactive display market, a few major players exert significant market dominance and have established a strong regional presence. These leading companies remain committed to continuous research and development endeavors and actively engage in strategic growth initiatives, including product development, launches, joint ventures, and partnerships. By pursuing these strategies, these companies aim to strengthen their market position, expand their customer base, and capture a substantial share of the market.
Some of the prominent players in the global interactive display market include LG Electronics, NEC Corporation, Sharp Corporation, Samsung Electronics Co. Ltd., ViewSonic Corporation, Planar Systems, Horizon Display Inc., Baanto International Ltd., Crystal Display Systems Ltd., Elo Touch Solutions and various other key players.
Global Interactive Display Market Recent Developments
In August 2022, Samsung and Signtouch collaborate to provide digital sales center technology to UK homebuilders. 'Signtouch, powered by Samsung', a ground-breaking digital sales center solution, has been introduced by Signtouch, a member of the Sign Build group of companies. It offers new homebuilders improved development marketing, sales performance, content management, footfall analytics, and customer experience, all through a single, user-friendly interactive platform.
Scope of the Global Interactive Display Market Report
Interactive Display Market Report Segmentation
|
ATTRIBUTE |
DETAILS |
|
By Panel Type |
|
|
By Technology |
|
|
By Application |
|
|
By End User |
|
|
By Geography |
|
|
Customization Scope |
|
|
Pricing |
|
Objectives of the Study
The objectives of the study are summarized in 5 stages. They are as mentioned below:
To identify and estimate the market size for the global interactive display market segmented by panel type, by application, by technology, by end user, region and by value (in U.S. dollars). Also, to understand the consumption/ demand created by consumers of interactive displays between 2019 and 2031.
To identify and infer the drivers, restraints, opportunities, and challenges for the global interactive display market
To find out the factors which are affecting the sales of interactive displays among consumers
To identify and understand the various factors involved in the global interactive display market affected by the pandemic
To provide a detailed insight into the major companies operating in the market. The profiling will include the financial health of the company's past 2-3 years with segmental and regional revenue breakup, product offering, recent developments, SWOT analysis, and key strategies.
Intended Audience
Research Methodology
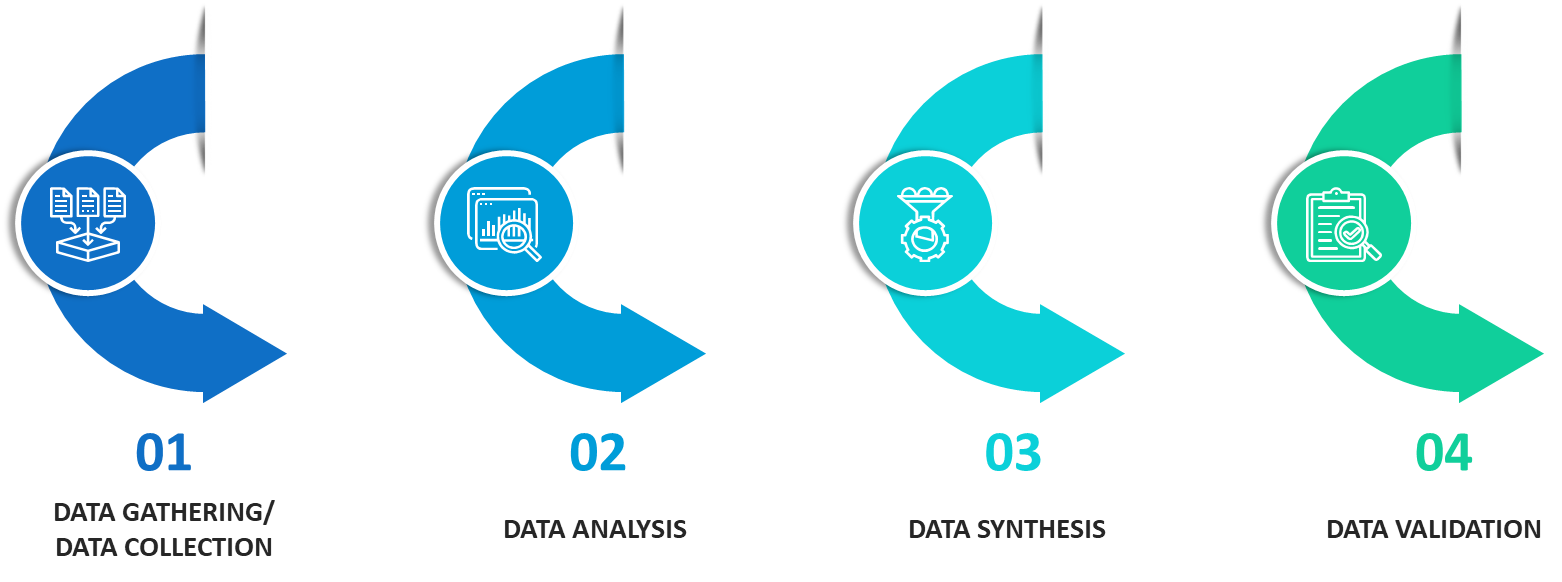
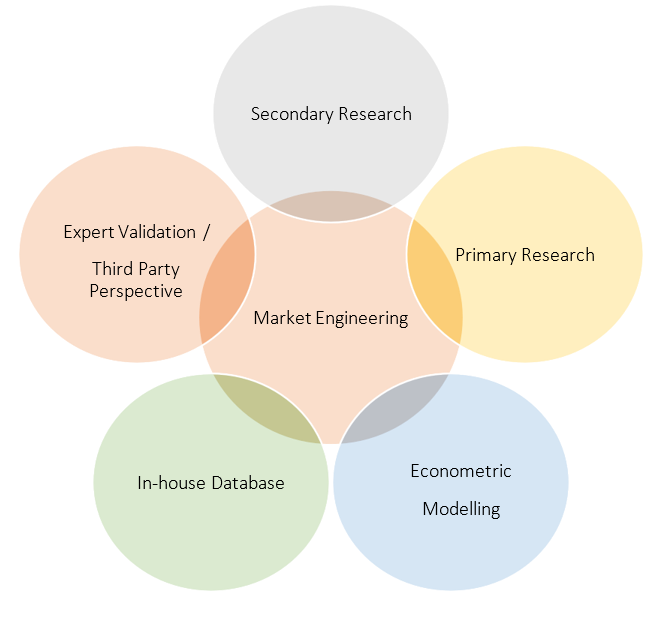
Our research methodology has always been the key differentiating reason which sets us apart in comparison from the competing organizations in the industry. Our organization believes in consistency along with quality and establishing a new level with every new report we generate; our methods are acclaimed and the data/information inside the report is coveted. Our research methodology involves a combination of primary and secondary research methods. Data procurement is one of the most extensive stages in our research process. Our organization helps in assisting the clients to find the opportunities by examining the market across the globe coupled with providing economic statistics for each and every region. The reports generated and published are based on primary & secondary research. In secondary research, we gather data for global Market through white papers, case studies, blogs, reference customers, news, articles, press releases, white papers, and research studies. We also have our paid data applications which includes hoovers, Bloomberg business week, Avention, and others.
Data Collection
Data collection is the process of gathering, measuring, and analyzing accurate and relevant data from a variety of sources to analyze market and forecast trends. Raw market data is obtained on a broad front. Data is continuously extracted and filtered to ensure only validated and authenticated sources are considered. Data is mined from a varied host of sources including secondary and primary sources.
Primary Research
After the secondary research process, we initiate the primary research phase in which we interact with companies operating within the market space. We interact with related industries to understand the factors that can drive or hamper a market. Exhaustive primary interviews are conducted. Various sources from both the supply and demand sides are interviewed to obtain qualitative and quantitative information for a report which includes suppliers, product providers, domain experts, CEOs, vice presidents, marketing & sales directors, Type & innovation directors, and related key executives from various key companies to ensure a holistic and unbiased picture of the market.
Secondary Research
A secondary research process is conducted to identify and collect information useful for the extensive, technical, market-oriented, and comprehensive study of the market. Secondary sources include published market studies, competitive information, white papers, analyst reports, government agencies, industry and trade associations, media sources, chambers of commerce, newsletters, trade publications, magazines, Bloomberg BusinessWeek, Factiva, D&B, annual reports, company house documents, investor presentations, articles, journals, blogs, and SEC filings of companies, newspapers, and so on. We have assigned weights to these parameters and quantified their market impacts using the weighted average analysis to derive the expected market growth rate.
Top-Down Approach & Bottom-Up Approach
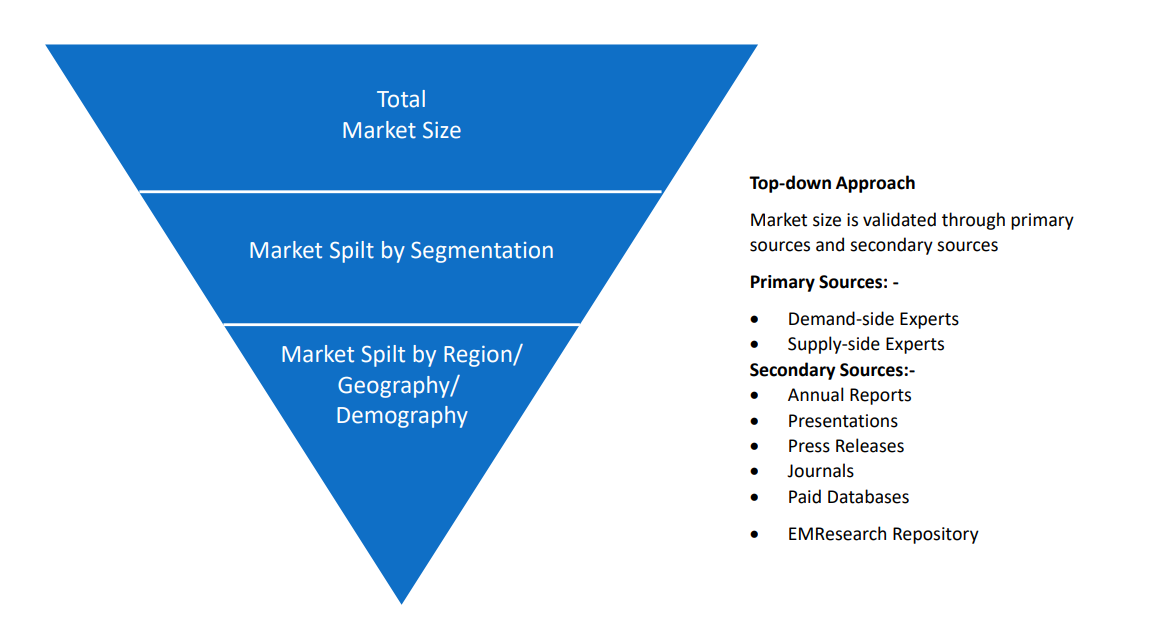
In the top – down approach, the Global Batteries for Solar Energy Storage Market was further divided into various segments on the basis of the percentage share of each segment. This approach helped in arriving at the market size of each segment globally. The segments market size was further broken down in the regional market size of each segment and sub-segments. The sub-segments were further broken down to country level market. The market size arrived using this approach was then crosschecked with the market size arrived by using bottom-up approach.
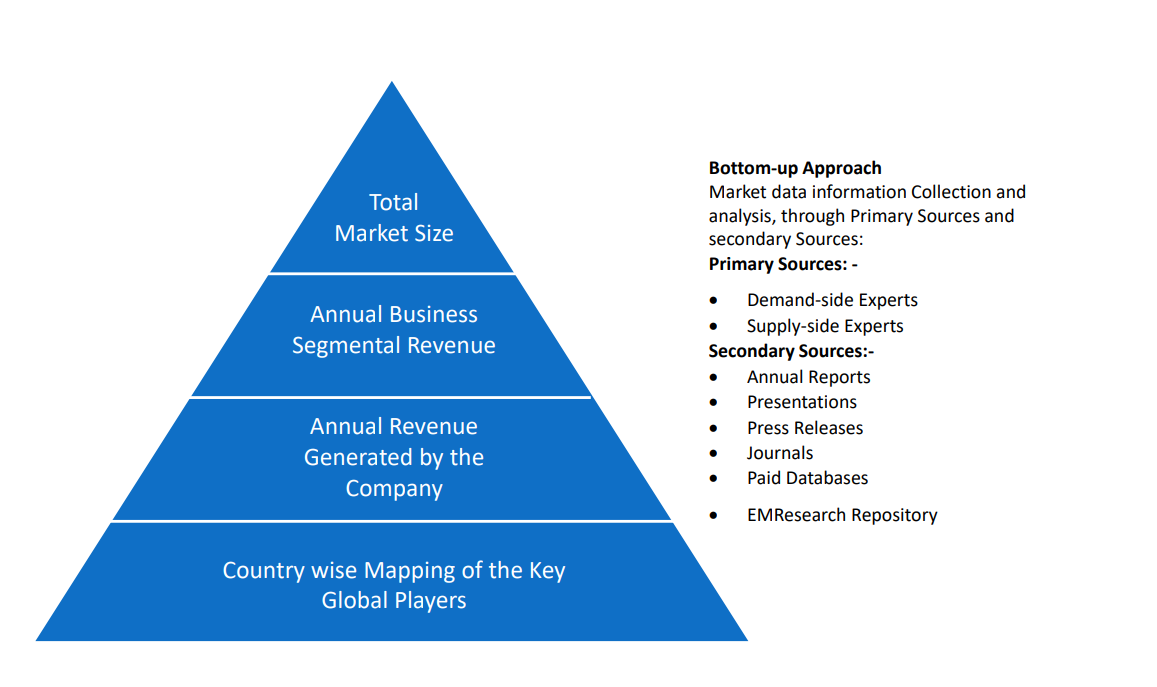
In the bottom-up approach, we arrived at the country market size by identifying the revenues and market shares of the key market players. The country market sizes then were added up to arrive at regional market size of the decorated apparel, which eventually added up to arrive at global market size.
This is one of the most reliable methods as the information is directly obtained from the key players in the market and is based on the primary interviews from the key opinion leaders associated with the firms considered in the research. Furthermore, the data obtained from the company sources and the primary respondents was validated through secondary sources including government publications and Bloomberg.
Market Analysis & size Estimation
Post the data mining stage, we gather our findings and analyze them, filtering out relevant insights. These are evaluated across research teams and industry experts. All this data is collected and evaluated by our analysts. The key players in the industry or markets are identified through extensive primary and secondary research. All percentage share splits, and breakdowns have been determined using secondary sources and verified through primary sources. The market size, in terms of value and volume, is determined through primary and secondary research processes, and forecasting models including the time series model, econometric model, judgmental forecasting model, the Delphi method, among Flywheel Energy Storage. Gathered information for market analysis, competitive landscape, growth trends, product development, and pricing trends is fed into the model and analyzed simultaneously.
Quality Checking & Final Review
The analysis done by the research team is further reviewed to check for the accuracy of the data provided to ensure the clients’ requirements. This approach provides essential checks and balances which facilitate the production of quality data. This Type of revision was done in two phases for the authenticity of the data and negligible errors in the report. After quality checking, the report is reviewed to look after the presentation, Type and to recheck if all the requirements of the clients were addressed.