Industrial IoT Display Market Size, Share, Trends, Growth, and Industry Analysis, By Technology (TFT-LCD, LED, OLED, and E-Paper display), By Application (Human Machine Interface, Remote Monitoring, Interactive Display, Electronic Shelf Labels, and Others), By Panel Size (Less than 10, Between 10 and 20, and more than 20), By End-Use Industry (Manufacturing, Healthcare, Energy & Power, Transportation, and Others), and Regional Insights and Forecast to 2032
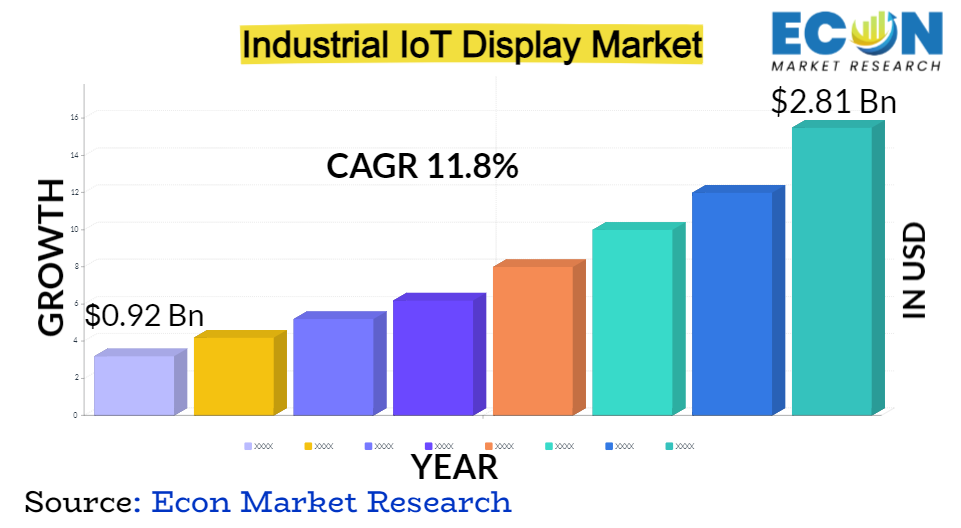
Industrial IoT Display Market size was USD 0.92 billion in 2022 and is predicted to reach USD 2.81 billion in 2032, exhibiting at a CAGR of 11.8% during the forecast period.
The integration of internet of things (IoT) technologies with display systems in industrial settings is referred to as industrial IoT display. It enables the monitoring, control, and visualization of important data from linked devices, machines, and sensors in real-time. Remote monitoring, predictive maintenance, and data analytics are just a few of the sophisticated features available on industrial IoT displays, which improve operational efficiency and decision-making processes. Through accessible dashboards and graphical interfaces, these displays give complete visual representations of data, allowing operators and managers to obtain insights into the performance, condition, and trends of industrial operations.
INDUSTRIAL IOT DISPLAY MARKET: REPORT SCOPE & SEGMENTATION
|
Report Attribute |
Details |
|
Estimated Market Value (2022) |
0.92 Bn |
|
Projected Market Value (2032) |
2.81 Bn |
|
Base Year |
2023 |
|
Forecast Years |
2024 - 2032 |
|
Scope of the Report |
Historical and Forecast Trends, Industry Drivers and Constraints, Historical and Forecast Market Analysis by Segment- By Technology, By Panel Size, By Application, By End-Use Industry, & Region |
|
Segments Covered |
By Technology, By Panel Size, By Application, By End-Use Industry, & Region |
|
Forecast Units |
Value (USD Billion or Million), and Volume (Units) |
|
Quantitative Units |
Revenue in USD million/billion and CAGR from 2024 to 2032 |
|
Regions Covered |
North America, Europe, Asia Pacific, Latin America, and Middle East & Africa, and Rest of World |
|
Countries Covered |
U.S., Canada, Mexico, U.K., Germany, France, Italy, Spain, China, India, Japan, South Korea, Brazil, Argentina, GCC Countries, and South Africa, among others |
|
Report Coverage |
Market growth drivers, restraints, opportunities, Porter’s five forces analysis, PEST analysis, value chain analysis, regulatory landscape, market attractiveness analysis by segments and region, company market share analysis, and COVID-19 impact analysis. |
|
Delivery Format |
Delivered as an attached PDF and Excel through email, according to the purchase option. |
Industrial IoT Display Market Dynamics
The growing usage of Industrial Internet of Things (IIoT) solutions across several sectors drives the demand for IoT displays to monitor and visualize linked devices and data. The rising need for sophisticated display systems is driven by the growing requirement for real-time monitoring, predictive maintenance, and data-driven decision-making in industrial processes. Furthermore, the growing emphasis on the improvement of operational efficiency, productivity, and the safety in industrial settings drives the market growth in the coming years. Furthermore, the rising adoption of technologies such as edge computing, cloud computing, and big data analytics, as well as the penetration of AI and machine learning, increases demand for IoT displays, which in turns drives the market growth during the forecast period.
Industrial IoT Display Market Drivers
The Industrial Internet of Things (IIoT) is driving the adoption of advanced technologies for automation in industrial processes. Industrial IoT displays play a crucial role in providing real-time monitoring, control, and visualization of data, leading to increased operational efficiency and productivity.
Restraints:
Deploying Industrial IoT display solutions requires significant investments in infrastructure, hardware, software, and connectivity. This can be a barrier for small and medium-sized enterprises (SMEs) with limited budgets, hindering widespread adoption.
Opportunities:
With increasing emphasis on sustainability, there is a growing demand for energy-efficient display solutions in industrial settings. Manufacturers can capitalize on this trend by developing displays with low power consumption and eco-friendly materials, aligning with the industry's sustainability goals.
Segment Overview
Based on technology, the global industrial IoT display market is divided into TFT-LCD, LED, OLED, and E-paper display. The TFT-LCD category dominates the market with the largest revenue share of around 42.3% in 2022. TFT-LCD displays have several advantages, such as high resolution, color accuracy, and rapid reaction times, making them appropriate for a wide range of applications. TFT-LCD technology has advanced significantly, resulting in better display quality and energy efficiency.
Based on end-use, the global industrial IoT display market is divided into manufacturing, healthcare, energy & power, transportation, and others. The transportation category dominates the market with the largest revenue share of around 36.4% in 2022. Transportation applications include automotive, aircraft, trains, and marine, all of which require display solutions for a variety of functions such as entertainment, navigation, safety systems, and passenger information.
Based on panel size, the global industrial IoT display market is divided into less than 10”, between 10” and 20”, and more than 20”. The more than 20” category is anticipated to grow at a higher CAGR of 13.2% during the forecast period. Larger screens give viewers with a more immersive and engaging experience. Larger display panel prices are falling as display technology advances, making them more affordable to a broader user base. Moreover, the rising need for bigger screens in areas like as advertising, entertainment, retail, and gaming is propelling the growth of the market over the forecast period.
Based on application, the global industrial IoT display market is divided into human-machine interface, remote monitoring, interactive display, electronic shelf labels, and others. The human-machine interface category is anticipated to grow at a higher CAGR of 13.7% during the forecast period. HMI is essential in industrial settings because it facilitates human-machine interaction. With the introduction of Industrial IoT, there is an increased demand for sophisticated HMI displays that provide intuitive and user-friendly interfaces for monitoring, controlling, and optimizing industrial processes. These displays allow operators to see real-time data, make educated decisions, and improve operational efficiency.
Industrial IoT Display Market Overview by Region
By Region, the global industrial IoT display market has been segmented into North America, Europe, Asia-Pacific, and the Rest of the World. North America accounted for around 34.7%, of the market share in 2022. This is due to a presence of a developed industrial sector that has rapidly adopted IoT technology and digital transformation. Also, sectors such as manufacturing, healthcare, and transportation industries are using IoT displays to improve operational efficiency, productivity, and decision-making processes. There are ample number of companies in the region are at the forefront of IoT innovation, pushing the development and acceptance of IoT display solutions, which drives the market growth over the coming years.
Industrial IoT Display Market Competitive Landscape
In the global industrial IoT display market only few of key players dominated the market and have a strong regional presence. These players are devoted to continued research and development efforts. They also actively participate in strategic growth initiatives like as product creation, product launches, joint ventures, and partnerships. These organizations intend to pursue these tactics in order to increase their market position and develop their client base in order to acquire a significant portion of the market.
Some of the leading companies in the global industrial IoT display market include E Ink Holdings Inc., BOE Technology Group Co., Ltd., Pepperl+Fuchs SE, Sharp Corporation, PDi Digital, Planar Systems, Inc., Winmate Inc., Maple Systems Inc., Advantech Co., Ltd., LG Electronics, American Industrial Systems Inc., Panasonic Corporation, Innolux Corporation, Display Technology Ltd., and various other key players.
Industrial IoT Display Market Recent Developments
Industrial IoT Display Market Report Segmentation
|
ATTRIBUTE |
DETAILS |
|
By Technology |
|
|
By Panel Size |
|
|
By Application |
|
|
By End-Use Industry |
|
|
By Geography |
|
|
Customization Scope |
|
|
Pricing |
|
Research Methodology
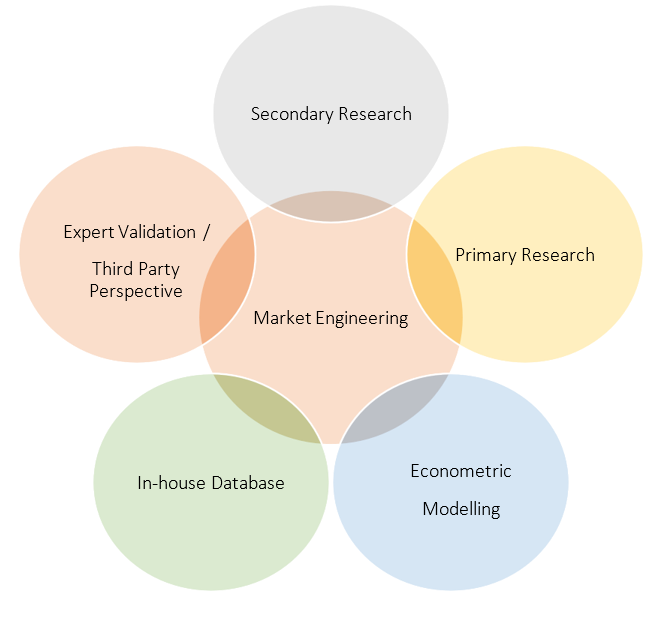
Our research methodology has always been the key differentiating reason which sets us apart in comparison from the competing organizations in the industry. Our organization believes in consistency along with quality and establishing a new level with every new report we generate; our methods are acclaimed and the data/information inside the report is coveted. Our research methodology involves a combination of primary and secondary research methods. Data procurement is one of the most extensive stages in our research process. Our organization helps in assisting the clients to find the opportunities by examining the market across the globe coupled with providing economic statistics for each and every region. The reports generated and published are based on primary & secondary research. In secondary research, we gather data for global Market through white papers, case studies, blogs, reference customers, news, articles, press releases, white papers, and research studies. We also have our paid data applications which includes hoovers, Bloomberg business week, Avention, and others.
Data Collection
Data collection is the process of gathering, measuring, and analyzing accurate and relevant data from a variety of sources to analyze market and forecast trends. Raw market data is obtained on a broad front. Data is continuously extracted and filtered to ensure only validated and authenticated sources are considered. Data is mined from a varied host of sources including secondary and primary sources.
Primary Research
After the secondary research process, we initiate the primary research phase in which we interact with companies operating within the market space. We interact with related industries to understand the factors that can drive or hamper a market. Exhaustive primary interviews are conducted. Various sources from both the supply and demand sides are interviewed to obtain qualitative and quantitative information for a report which includes suppliers, product providers, domain experts, CEOs, vice presidents, marketing & sales directors, Type & innovation directors, and related key executives from various key companies to ensure a holistic and unbiased picture of the market.
Secondary Research
A secondary research process is conducted to identify and collect information useful for the extensive, technical, market-oriented, and comprehensive study of the market. Secondary sources include published market studies, competitive information, white papers, analyst reports, government agencies, industry and trade associations, media sources, chambers of commerce, newsletters, trade publications, magazines, Bloomberg BusinessWeek, Factiva, D&B, annual reports, company house documents, investor presentations, articles, journals, blogs, and SEC filings of companies, newspapers, and so on. We have assigned weights to these parameters and quantified their market impacts using the weighted average analysis to derive the expected market growth rate.
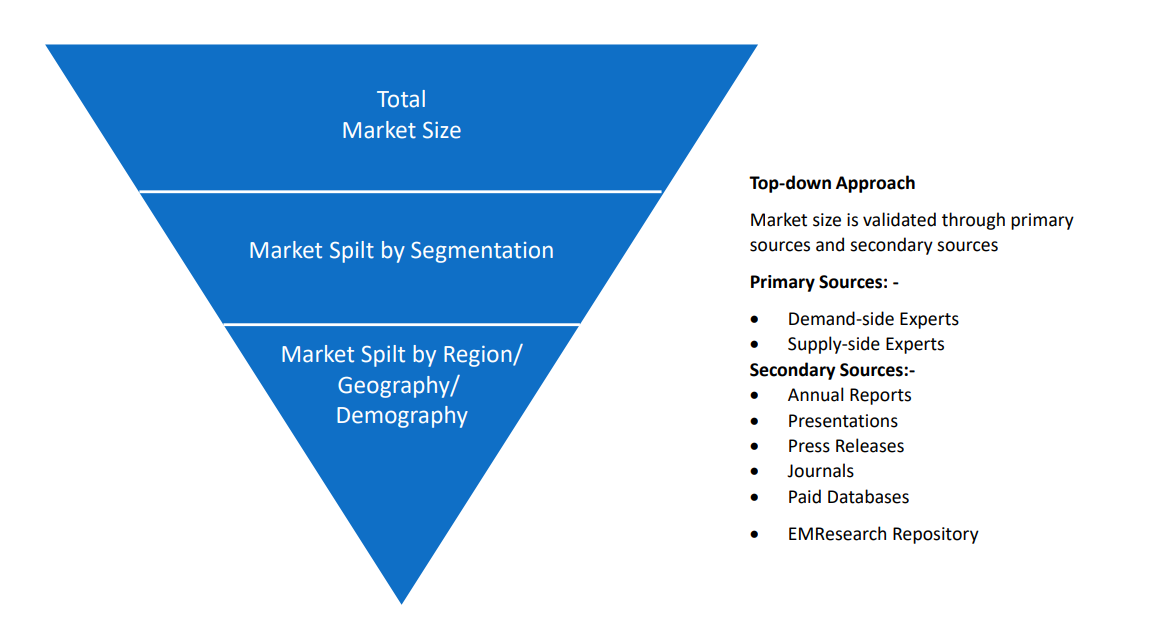
Top-Down Approach & Bottom-Up Approach
In the top – down approach, the Global Batteries for Solar Energy Storage Market was further divided into various segments on the basis of the percentage share of each segment. This approach helped in arriving at the market size of each segment globally. The segments market size was further broken down in the regional market size of each segment and sub-segments. The sub-segments were further broken down to country level market. The market size arrived using this approach was then crosschecked with the market size arrived by using bottom-up approach.
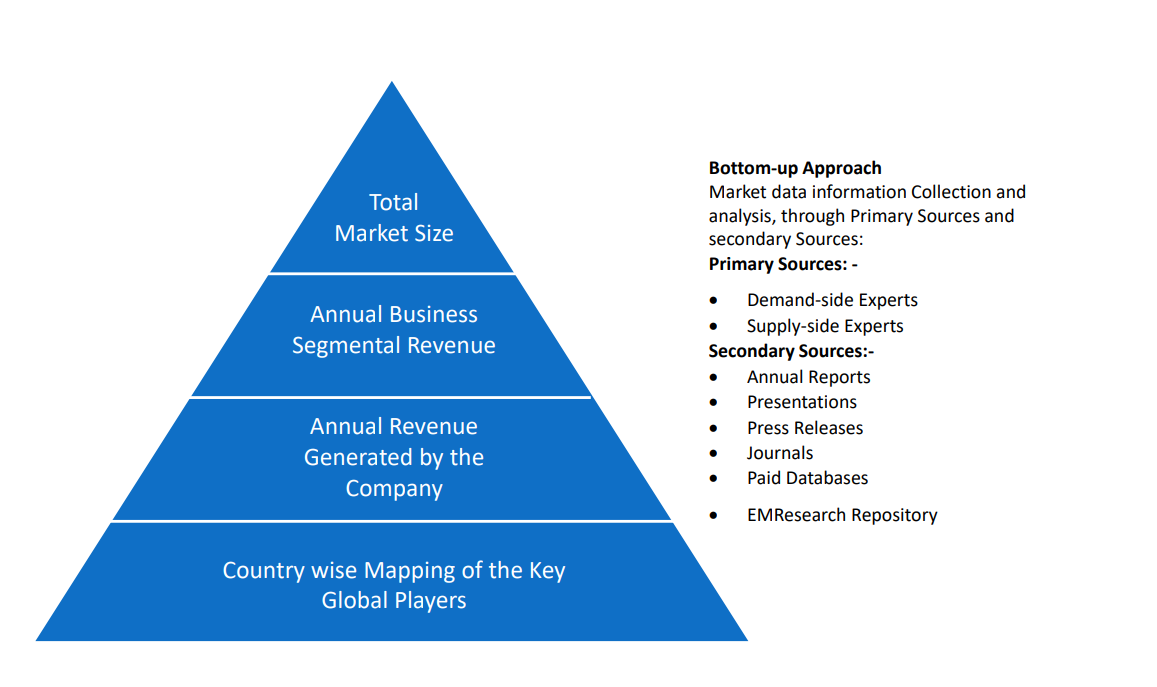
In the bottom-up approach, we arrived at the country market size by identifying the revenues and market shares of the key market players. The country market sizes then were added up to arrive at regional market size of the decorated apparel, which eventually added up to arrive at global market size.
This is one of the most reliable methods as the information is directly obtained from the key players in the market and is based on the primary interviews from the key opinion leaders associated with the firms considered in the research. Furthermore, the data obtained from the company sources and the primary respondents was validated through secondary sources including government publications and Bloomberg.
Market Analysis & size Estimation
Post the data mining stage, we gather our findings and analyze them, filtering out relevant insights. These are evaluated across research teams and industry experts. All this data is collected and evaluated by our analysts. The key players in the industry or markets are identified through extensive primary and secondary research. All percentage share splits, and breakdowns have been determined using secondary sources and verified through primary sources. The market size, in terms of value and volume, is determined through primary and secondary research processes, and forecasting models including the time series model, econometric model, judgmental forecasting model, the Delphi method, among Flywheel Energy Storage. Gathered information for market analysis, competitive landscape, growth trends, product development, and pricing trends is fed into the model and analyzed simultaneously.
Quality Checking & Final Review
The analysis done by the research team is further reviewed to check for the accuracy of the data provided to ensure the clients’ requirements. This approach provides essential checks and balances which facilitate the production of quality data. This Type of revision was done in two phases for the authenticity of the data and negligible errors in the report. After quality checking, the report is reviewed to look after the presentation, Type and to recheck if all the requirements of the clients were addressed.
 +1 812 506 4440
 +91 7875074426