Green Ammonia Market Size, Share, Trends, Growth, and Industry Analysis, By Production Process (Alkaline Water Electrolysis, Proton Exchange Membrane, and Solid Oxide Electrolysis), End-Use (Fertilizer, Transportation, Power Generation, Industrial Feedstock and Others), Regional Analysis, Competitor Analysis and Forecast 2032.
Global Green Ammonia market is predicted to reach approximately USD 12,983.35 million by 2032, at a CAGR of 63.87% from 2024 to 2032.
Green ammonia, also known as sustainable or renewable ammonia, is produced using renewable energy sources such as wind, solar, or hydroelectric power to electrolyze water, separating hydrogen for subsequent synthesis with nitrogen derived from the air. This process avoids the carbon emissions associated with traditional ammonia production methods, making green ammonia a key player in the transition towards a low-carbon economy.
The market is being driven by increasing environmental concerns, stringent regulations aimed at reducing greenhouse gas emissions, and growing demand for clean energy solutions. Key players in the market are investing heavily in research and development to enhance production efficiency, lower costs, and scale up green ammonia production. Additionally, partnerships and collaborations between governments, industry stakeholders, and research institutions are fostering innovation and driving market growth. The Asia-Pacific region is expected to dominate the market, fuelled by rapid industrialization, government initiatives promoting renewable energy adoption, and increasing investments in green technology. However, challenges such as high initial capital costs, technological limitations, and the need for supportive policies and infrastructure remain obstacles to widespread adoption.
Global Green Ammonia report scope and segmentation.
|
Report Attribute |
Details |
|
Estimated Market Value (2023) |
USD 152.35 Million |
|
Projected Market Value (2032) |
USD 12,983.35 Million |
|
Base Year |
2023 |
|
Forecast Years |
2024 – 2032 |
|
Scope of the Report |
Historical and Forecast Trends, Industry Drivers and Constraints, Historical and Forecast Market Analysis by Segment- Based on By Production Process, By End-Use, & Region. |
|
Segments Covered |
By Production Process, By End-Use, & By Region. |
|
Forecast Units |
Value (USD Billion or Million), and Volume (Units) |
|
Quantitative Units |
Revenue in USD million/billion and CAGR from 2024 to 2032. |
|
Regions Covered |
North America, Europe, Asia Pacific, Latin America, and Middle East & Africa. |
|
Countries Covered |
U.S., Canada, Mexico, U.K., Germany, France, Italy, Spain, China, India, Japan, South Korea, Brazil, Argentina, GCC Countries, and South Africa, among others. |
|
Report Coverage |
Market growth drivers, restraints, opportunities, Porter’s five forces analysis, PEST analysis, value chain analysis, regulatory landscape, market attractiveness analysis by segments and region, company market share analysis. |
|
Delivery Format |
Delivered as an attached PDF and Excel through email, according to the purchase option. |
Global Green Ammonia dynamics
Increasing environmental concerns and stringent regulations aimed at reducing carbon emissions are major drivers propelling the market forward. As governments worldwide prioritize sustainability and climate change mitigation, the demand for clean energy solutions like green ammonia continues to rise. Additionally, the growing awareness of the environmental impact of traditional ammonia production methods is prompting industries to shift towards more sustainable alternatives, further fuelling market growth. Furthermore, the rapid expansion of renewable energy sources such as wind and solar power is providing the necessary infrastructure for green ammonia production, creating opportunities for market players to capitalize on. Moreover, technological advancements and innovations in green ammonia production processes are driving efficiency improvements and cost reductions, making green ammonia increasingly competitive compared to conventional ammonia. However, challenges such as high initial capital investments, technological limitations, and the need for supportive policies and infrastructure pose hurdles to market expansion.
Global Green Ammonia drivers
The escalating awareness of climate change and its adverse effects on the environment is a significant driver for the green ammonia market. As traditional ammonia production methods heavily rely on fossil fuels, they contribute significantly to greenhouse gas emissions. However, green ammonia production offers a sustainable alternative by utilizing renewable energy sources such as wind, solar, or hydroelectric power. This aligns with global efforts to reduce carbon footprints and transition towards cleaner energy solutions. As a result, governments and industries worldwide are increasingly incentivizing the adoption of green ammonia, driving market growth.
Green ammonia is becoming more and more popular due to strict regulations meant to reduce greenhouse gas emissions. All across the world, governments are putting laws and programmes into place to reduce carbon emissions and encourage the use of renewable energy. Carbon pricing, emission trading, and renewable energy mandates, for example, encourage industry investment in low-carbon technologies such as green ammonia production. These regulations encourage adherence to sustainability guidelines and stimulate innovation in clean energy technologies, which in turn creates a favourable market environment for green ammonia. As a result, the increasing regulatory pressure on businesses to lessen their carbon footprint stimulates market growth.
Restraints:
The tremendous upfront costs associated with setting up facilities to produce green ammonia are a major barrier to market expansion. Although green ammonia has advantages for sustainability over the long run, many businesses may find it prohibitive to bear the initial costs of developing infrastructure, buying equipment, and implementing technology. Furthermore, doubts about market demand and investment returns discourage prospective investors from investing in green ammonia projects. As a result, significant financial obstacles prevent green ammonia from being widely adopted, especially by smaller market participants.
Market expansion is hampered by scalability issues and technological constraints in the production of green ammonia. Although technologies for nitrogen fixation and electrolysis have advanced, it is still difficult to scale up the production of green ammonia to meet industrial demand. The implementation of large-scale green ammonia production is impeded by various issues, including but not limited to low efficiency, limited production capacity, and dependence on intermittent renewable energy sources. Additionally, integration into current ammonia value chains is made more difficult by the absence of standardised procedures and infrastructure for green ammonia synthesis. In order to ensure cost competitiveness in the green ammonia market, improve efficiency, and optimise production processes, persistent research and development efforts are necessary to overcome these technological obstacles.
Opportunities:
There are a lot of opportunities for the green ammonia market due to the infrastructure for renewable energy expanding quickly. An increasingly economical and sustainable method of producing green ammonia is made possible by growing investments in hydroelectric, solar, and wind power generation. Green ammonia production can achieve greater efficiency and lower costs by utilising abundant renewable energy resources, which will increase its market competitiveness and scalability. Furthermore, integrated energy systems that improve energy security and resilience while lowering carbon emissions can be created through the synergies between renewable energy and green ammonia production.
Segment Overview
The green ammonia market encompasses various production processes, including alkaline water electrolysis, proton exchange membrane (PEM), and solid oxide electrolysis. Alkaline water electrolysis involves splitting water into hydrogen and oxygen using an alkaline electrolyte solution, typically potassium hydroxide. This process is characterized by its simplicity and maturity, making it a cost-effective option for green ammonia production. Proton exchange membrane electrolysis utilizes a solid polymer electrolyte membrane to separate hydrogen ions from water molecules, offering higher efficiency and scalability compared to alkaline electrolysis. Solid oxide electrolysis operates at high temperatures using a ceramic electrolyte, enabling direct electrolysis of steam to produce hydrogen. Although still in the development stage, solid oxide electrolysis holds promise for its potential to achieve high conversion efficiencies and utilize waste heat for process heating, contributing to overall energy efficiency in green ammonia production.
The green ammonia market caters to diverse end-use applications, including fertilizer production, transportation, power generation, industrial feedstock, and others. Fertilizer production represents a significant end-use sector for green ammonia, as ammonia is a key ingredient in nitrogen-based fertilizers essential for crop growth. Green ammonia offers a sustainable alternative to conventional ammonia in fertilizer manufacturing, reducing reliance on fossil fuels and minimizing environmental impacts. Transportation presents another promising end-use application for green ammonia, particularly in fuelling hydrogen fuel cell vehicles and marine vessels. As a carbon-neutral fuel, green ammonia offers long-term potential for decarbonizing transportation sectors and reducing greenhouse gas emissions. Additionally, green ammonia can be used for power generation in fuel cells or combustion turbines, providing clean and reliable energy solutions. Industrial feedstock applications encompass a wide range of uses, including chemical synthesis, refrigeration, and wastewater treatment, where green ammonia serves as a versatile and eco-friendly raw material.
Global Green Ammonia Overview by Region
In North America, stringent environmental regulations, coupled with robust investments in renewable energy infrastructure, are driving market growth. The region's well-established agricultural sector and increasing emphasis on sustainable farming practices further bolster demand for green ammonia in fertilizer production. Similarly, Europe leads the global green ammonia market, propelled by ambitious sustainability targets, supportive regulatory frameworks, and significant investments in renewable energy projects. The European Union's Green Deal and carbon-neutral initiatives aim to accelerate the transition to a low-carbon economy, providing a conducive environment for green ammonia adoption across industries.
Asia-Pacific emerges as a lucrative market for green ammonia, fuelled by rapid industrialization, burgeoning population, and growing energy demand. Government initiatives promoting renewable energy deployment, coupled with increasing investments in green technology, drive market expansion in the region. Furthermore, rising environmental awareness and concerns over air pollution and climate change underscore the importance of transitioning towards cleaner energy sources like green ammonia. Meanwhile, regions like Latin America, the Middle East, and Africa present untapped opportunities for market growth, driven by abundant renewable energy resources, growing demand for sustainable solutions, and supportive policy frameworks. However, challenges such as limited infrastructure, technological barriers, and economic constraints may hinder market development in these regions.
Global Green Ammonia market competitive landscape
Major industry participants such as Siemens, Yara International, Thyssenkrupp, and ITM Power are actively engaged in research and development initiatives to enhance production efficiency, reduce costs, and scale up green ammonia production. These companies focus on technological innovation and strategic partnerships to strengthen their market position and expand their presence across regions. Additionally, collaborations between governments, industry stakeholders, and research institutions foster innovation and drive market growth. New entrants and start-ups are also entering the market, leveraging disruptive technologies and business models to capture niche segments and drive market disruption. Furthermore, mergers, acquisitions, and joint ventures are prevalent strategies among market players to consolidate their market presence, diversify product offerings, and expand into new geographical markets.
Global Green Ammonia Recent Developments
Scope of global Green Ammonia report
Global Green Ammonia report segmentation
|
ATTRIBUTE |
DETAILS |
|
By Production Process |
|
|
By End-Use |
|
|
By Geography |
|
|
Customization Scope |
|
|
Pricing |
|
Objectives of the Study
The objectives of the study are summarized in 5 stages. They are as mentioned below:
Research Methodology
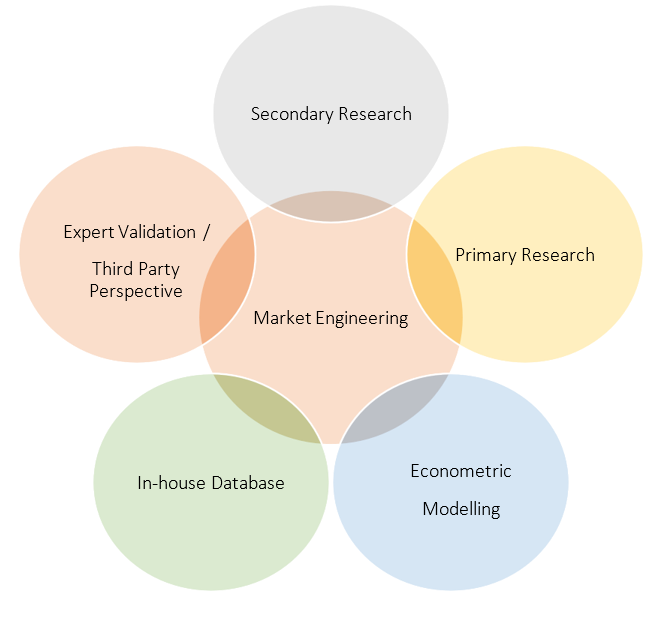
Our research methodology has always been the key differentiating reason which sets us apart in comparison from the competing organizations in the industry. Our organization believes in consistency along with quality and establishing a new level with every new report we generate; our methods are acclaimed and the data/information inside the report is coveted. Our research methodology involves a combination of primary and secondary research methods. Data procurement is one of the most extensive stages in our research process. Our organization helps in assisting the clients to find the opportunities by examining the market across the globe coupled with providing economic statistics for each and every region. The reports generated and published are based on primary & secondary research. In secondary research, we gather data for global Market through white papers, case studies, blogs, reference customers, news, articles, press releases, white papers, and research studies. We also have our paid data applications which includes hoovers, Bloomberg business week, Avention, and others.
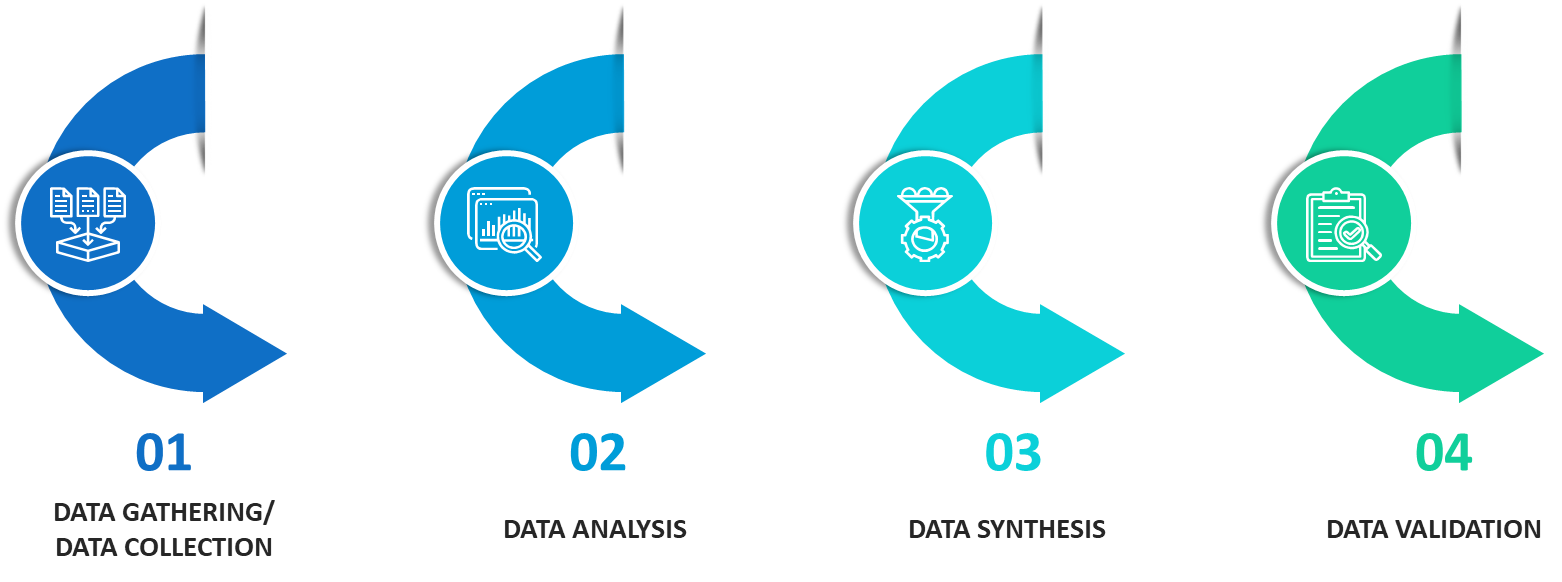
Data Collection
Data collection is the process of gathering, measuring, and analyzing accurate and relevant data from a variety of sources to analyze market and forecast trends. Raw market data is obtained on a broad front. Data is continuously extracted and filtered to ensure only validated and authenticated sources are considered. Data is mined from a varied host of sources including secondary and primary sources.
Primary Research
After the secondary research process, we initiate the primary research phase in which we interact with companies operating within the market space. We interact with related industries to understand the factors that can drive or hamper a market. Exhaustive primary interviews are conducted. Various sources from both the supply and demand sides are interviewed to obtain qualitative and quantitative information for a report which includes suppliers, product providers, domain experts, CEOs, vice presidents, marketing & sales directors, Type & innovation directors, and related key executives from various key companies to ensure a holistic and unbiased picture of the market.
Secondary Research
A secondary research process is conducted to identify and collect information useful for the extensive, technical, market-oriented, and comprehensive study of the market. Secondary sources include published market studies, competitive information, white papers, analyst reports, government agencies, industry and trade associations, media sources, chambers of commerce, newsletters, trade publications, magazines, Bloomberg BusinessWeek, Factiva, D&B, annual reports, company house documents, investor presentations, articles, journals, blogs, and SEC filings of companies, newspapers, and so on. We have assigned weights to these parameters and quantified their market impacts using the weighted average analysis to derive the expected market growth rate.
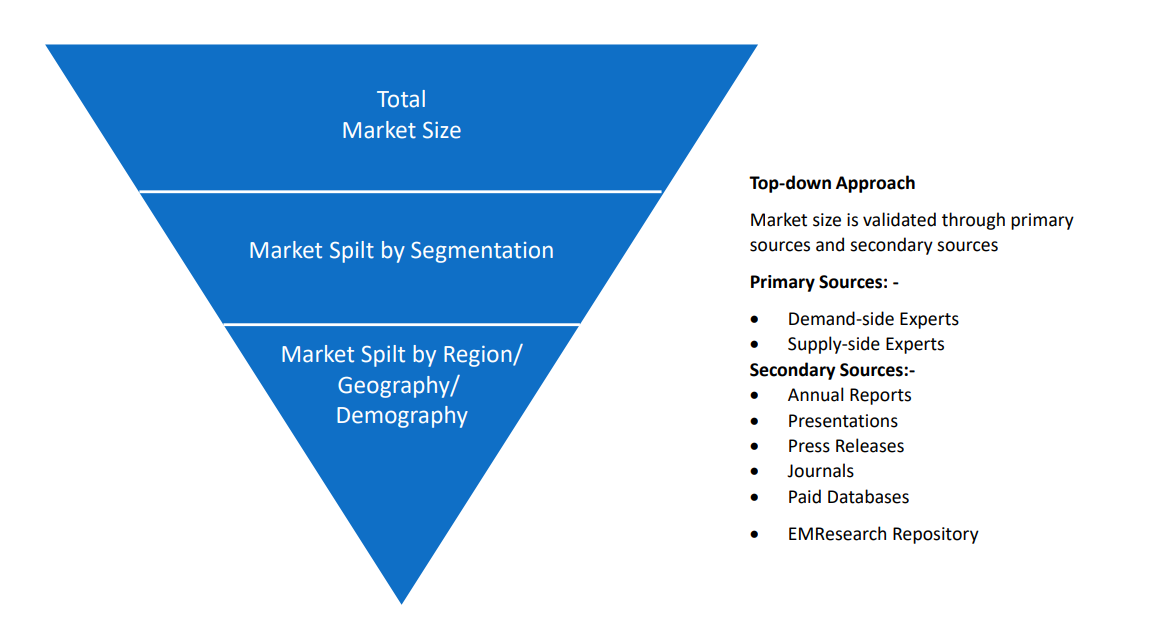
Top-Down Approach & Bottom-Up Approach
In the top – down approach, the Global Batteries for Solar Energy Storage Market was further divided into various segments on the basis of the percentage share of each segment. This approach helped in arriving at the market size of each segment globally. The segments market size was further broken down in the regional market size of each segment and sub-segments. The sub-segments were further broken down to country level market. The market size arrived using this approach was then crosschecked with the market size arrived by using bottom-up approach.
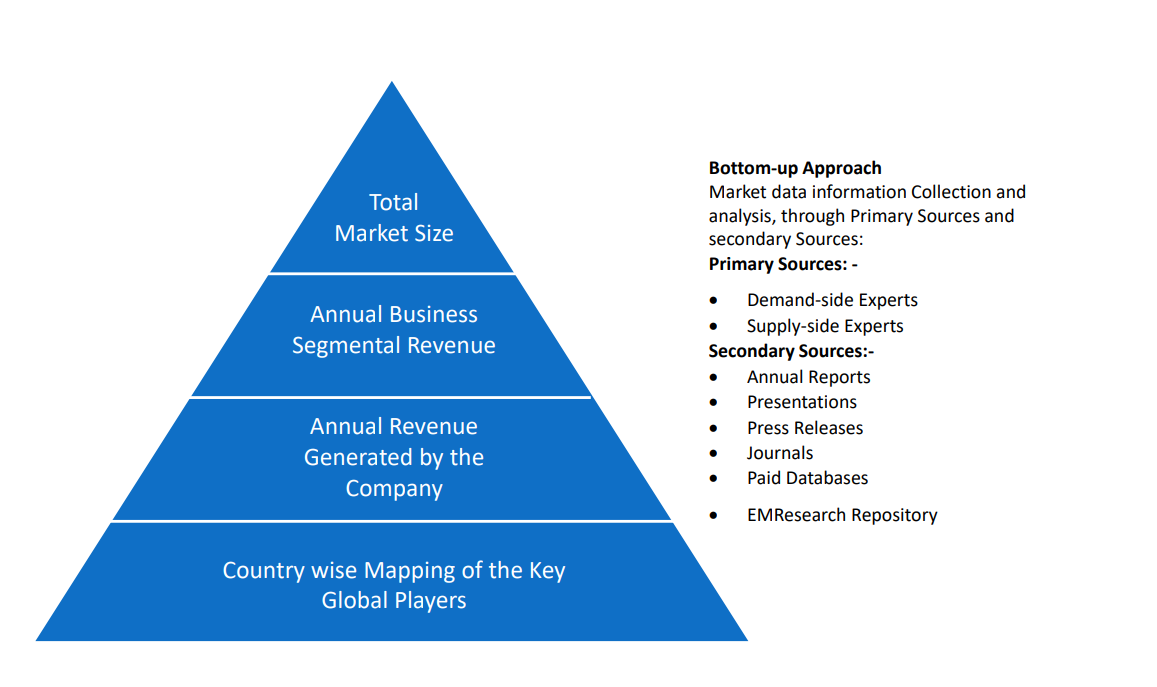
In the bottom-up approach, we arrived at the country market size by identifying the revenues and market shares of the key market players. The country market sizes then were added up to arrive at regional market size of the decorated apparel, which eventually added up to arrive at global market size.
This is one of the most reliable methods as the information is directly obtained from the key players in the market and is based on the primary interviews from the key opinion leaders associated with the firms considered in the research. Furthermore, the data obtained from the company sources and the primary respondents was validated through secondary sources including government publications and Bloomberg.
Market Analysis & size Estimation
Post the data mining stage, we gather our findings and analyze them, filtering out relevant insights. These are evaluated across research teams and industry experts. All this data is collected and evaluated by our analysts. The key players in the industry or markets are identified through extensive primary and secondary research. All percentage share splits, and breakdowns have been determined using secondary sources and verified through primary sources. The market size, in terms of value and volume, is determined through primary and secondary research processes, and forecasting models including the time series model, econometric model, judgmental forecasting model, the Delphi method, among Flywheel Energy Storage. Gathered information for market analysis, competitive landscape, growth trends, product development, and pricing trends is fed into the model and analyzed simultaneously.
Quality Checking & Final Review
The analysis done by the research team is further reviewed to check for the accuracy of the data provided to ensure the clients’ requirements. This approach provides essential checks and balances which facilitate the production of quality data. This Type of revision was done in two phases for the authenticity of the data and negligible errors in the report. After quality checking, the report is reviewed to look after the presentation, Type and to recheck if all the requirements of the clients were addressed.