Ethernet Card Market Size, Share, Trends, Growth, and Industry Analysis, By Based on Speed (1 Gigabit Ethernet (1 GbE), 10 Gigabit Ethernet (10 GbE), 25 Gigabit Ethernet (25 GbE), 40 Gigabit Ethernet (40 GbE), 100 Gigabit Ethernet (100 GbE), Others (including 50 GbE, 200 GbE, and 400 GbE)), By Based on Form Factor (PCI Express (PCIe) Cards, Small Form Factor Pluggable (SFP) Cards, Copper Ethernet Cards Quad Small Form Factor Pluggable (QSFP) Cards, Fiber Optic Ethernet Cards, Others (including mezzanine cards, integrated network adapters, etc.)), By End User (BFSI (Banking, Financial Services, and Insurance), Education, Energy and Utilities, Healthcare, IT and Telecom, Government and Defense, Manufacturing, Retail, Transportation and Logistics and Others), Regional Analysis and Forecast 2032.
Global Ethernet Card market is predicted to reach approximately USD 13.41 billion by 2032, at a CAGR of 9.80% from 2024 to 2032.
The Ethernet Card market comprises essential hardware components facilitating computer connectivity to local networks or the internet. These cards, also known as network interface cards (NICs), serve as vital conduits for data transmission, translating information into a format compatible with Ethernet cables. Integral to various sectors such as IT, telecommunications, healthcare, and education, Ethernet cards support seamless communication between devices and access to online resources. Market growth is propelled by escalating demand for swift and dependable networking solutions, spurred by the expansion of cloud computing services, proliferation of internet-connected devices, and increasing reliance on data-intensive applications. Technological advancements, including gigabit and 10-gigabit Ethernet standards, drive demand for cards with enhanced data transfer speeds and bandwidth capacity.
Global Ethernet Card report scope and segmentation.
|
Report Attribute |
Details |
|
Estimated Market Value (2023) |
USD 5.78 Billion |
|
Projected Market Value (2032) |
USD 13.41 Billion |
|
Base Year |
2023 |
|
Forecast Years |
2024 – 2032 |
|
Scope of the Report |
Historical and Forecast Trends, Industry Drivers and Constraints, Historical and Forecast Market Analysis by Segment- Based on By Speed, By Form Factor, By End-User, By Application, & Region. |
|
Segments Covered |
By Speed, By Form Factor, By End-User, By Application, & By Region. |
|
Forecast Units |
Value (USD Million or Billion), and Volume (Units) |
|
Quantitative Units |
Revenue in USD Million/billion and CAGR from 2024 to 2032. |
|
Regions Covered |
North America, Europe, Asia Pacific, Latin America, and Middle East & Africa. |
|
Countries Covered |
U.S., Canada, Mexico, U.K., Germany, France, Italy, Spain, China, India, Japan, South Korea, Brazil, Argentina, GCC Countries, and South Africa, among others. |
|
Report Coverage |
Market growth drivers, restraints, opportunities, Porter’s five forces analysis, PEST analysis, value chain analysis, regulatory landscape, market attractiveness analysis by segments and region, company market share analysis. |
|
Delivery Format |
Delivered as an attached PDF and Excel through email, according to the purchase option. |
Global Ethernet Card dynamics
The emergence of gigabit and 10-gigabit Ethernet standards has significantly impacted market dynamics, as businesses and consumers increasingly seek higher data transfer speeds and greater bandwidth capacity to support their evolving digital needs. Additionally, the proliferation of internet-connected devices, driven by trends such as the Internet of Things (IoT) and smart home technology, has fuelled demand for Ethernet cards across various sectors.
Another important factor influencing the Ethernet Card market is market competition. Through tactics including product diversification, pricing strategies, and mergers and acquisitions, vendors compete for market share. In order to keep ahead of the competition, businesses are forced to constantly improve the products they offer and add value to their services. Furthermore, the dynamics of the market can be impacted by pricing pressure brought on by fierce competition, which can affect profit margins and push vendors to look for more affordable manufacturing and distribution options.
Furthermore, the Ethernet Card market is subject to regulatory and industry standards, which can affect product development and market access. Compliance with standards ensures interoperability and compatibility among networking devices, driving market growth and fostering consumer trust. However, regulatory changes and evolving industry standards may pose challenges for market players, necessitating adaptability and agility in response to shifting requirements.
Global Ethernet Card drivers
Continuous technical developments, especially in data transmission speeds and bandwidth capacity, are driving the demand for Ethernet cards. The 10-gigabit and gigabit Ethernet standards' development has greatly boosted market expansion. These developments fulfil the growing need for high-speed networking solutions across a range of industries by enabling faster and more effective data transfer. Furthermore, Ethernet card technological developments frequently result in increased performance, dependability, and compatibility, improving the overall value proposition for customers and encouraging adoption.
The proliferation of internet-connected devices, driven by trends such as the Internet of Things (IoT) and smart home technology, acts as a significant driver for the Ethernet Card market. With the increasing number of devices requiring network connectivity, such as smartphones, tablets, smart appliances, and IoT sensors, the demand for Ethernet cards continues to rise. These devices rely on Ethernet cards to establish reliable connections to local networks and the internet, driving demand for networking hardware. Additionally, the expansion of smart infrastructure projects and the deployment of 5G networks further amplify the need for robust networking solutions, driving market growth.
Restraints:
Wi-Fi and Bluetooth are two alternative networking technologies that compete with Ethernet cards in the market. Physical Ethernet connections are no longer necessary thanks to these wireless technologies, which also offer ease and flexibility. Because of this, people might choose wireless networking solutions over Ethernet cards, especially in settings where mobility is crucial. Because of this competition, market growth is constrained, which forces Ethernet card manufacturers to innovate and set themselves apart from the competitors in order to stay competitive.
The Ethernet card industry is very competitive, which may put pressure on prices and reduce vendors' margins. Price-conscious customers and companies might pick less expensive options over high-end Ethernet cards, which would affect suppliers' profit margins. Profitability may also be further impacted by changes in manufacturing costs and component prices. Vendors must concentrate on cost-optimization techniques, such as effective supply chain management and economies of scale, to counteract these limitations and preserve competitiveness without sacrificing profitability.
Opportunities:
The increasing adoption of cloud computing services, data-intensive applications, and bandwidth-intensive technologies presents a significant opportunity for the Ethernet Card market. Businesses and consumers require high-speed networking solutions to support their evolving digital needs, driving demand for Ethernet cards with enhanced data transfer speeds and bandwidth capacity. Manufacturers can capitalize on this opportunity by offering innovative Ethernet card solutions tailored to meet the demands of modern networking environments.
Segment Overview
The segmentation of the Ethernet Card market by speed categorizes cards based on their data transfer rates, catering to varying networking requirements. The market encompasses a range of Ethernet card speeds, including 1 Gigabit Ethernet (1 GbE), 10 Gigabit Ethernet (10 GbE), 25 Gigabit Ethernet (25 GbE), 40 Gigabit Ethernet (40 GbE), and 100 Gigabit Ethernet (100 GbE), with additional categories for other speeds such as 50 GbE, 200 GbE, and 400 GbE. Each speed category offers different levels of performance and bandwidth capacity, allowing businesses and consumers to select Ethernet cards that align with their specific networking needs. For instance, higher-speed Ethernet cards like 100 GbE are suited for data-intensive applications and large-scale network deployments, while lower-speed options like 1 GbE may suffice for smaller-scale networks or less demanding use cases.
Ethernet cards are also segmented by form factor, which refers to the physical design and interface of the card. Common form factors include PCI Express (PCIe) cards, Small Form Factor Pluggable (SFP) cards, and Quad Small Form Factor Pluggable (QSFP) cards, each offering distinct advantages in terms of compatibility, flexibility, and scalability. Additionally, Ethernet cards are available in different types based on their transmission medium, including copper Ethernet cards for use with traditional Ethernet cabling and fiber optic Ethernet cards for long-distance and high-bandwidth applications. Other form factors may include proprietary designs or specialized configurations tailored to specific networking environments or industry requirements. The choice of form factor depends on factors such as the available infrastructure, compatibility with existing hardware, and the desired level of performance and functionality.
Segmentation by end user categorizes Ethernet card usage based on industry verticals and specific business sectors. This segmentation reflects the diverse applications and use cases of Ethernet cards across various industries, including BFSI (Banking, Financial Services, and Insurance), Education, Energy and Utilities, Government and Defense, Healthcare, IT and Telecom, Manufacturing, Retail, Transportation and Logistics, and others. Different industries have unique networking requirements and regulatory considerations, influencing the selection and deployment of Ethernet cards. For example, industries such as healthcare and finance may prioritize security and compliance, while manufacturing and logistics sectors may focus on scalability and reliability. Understanding the specific needs and challenges of each industry segment enables Ethernet card manufacturers to develop tailored solutions and provide value-added services to meet customer demands effectively.
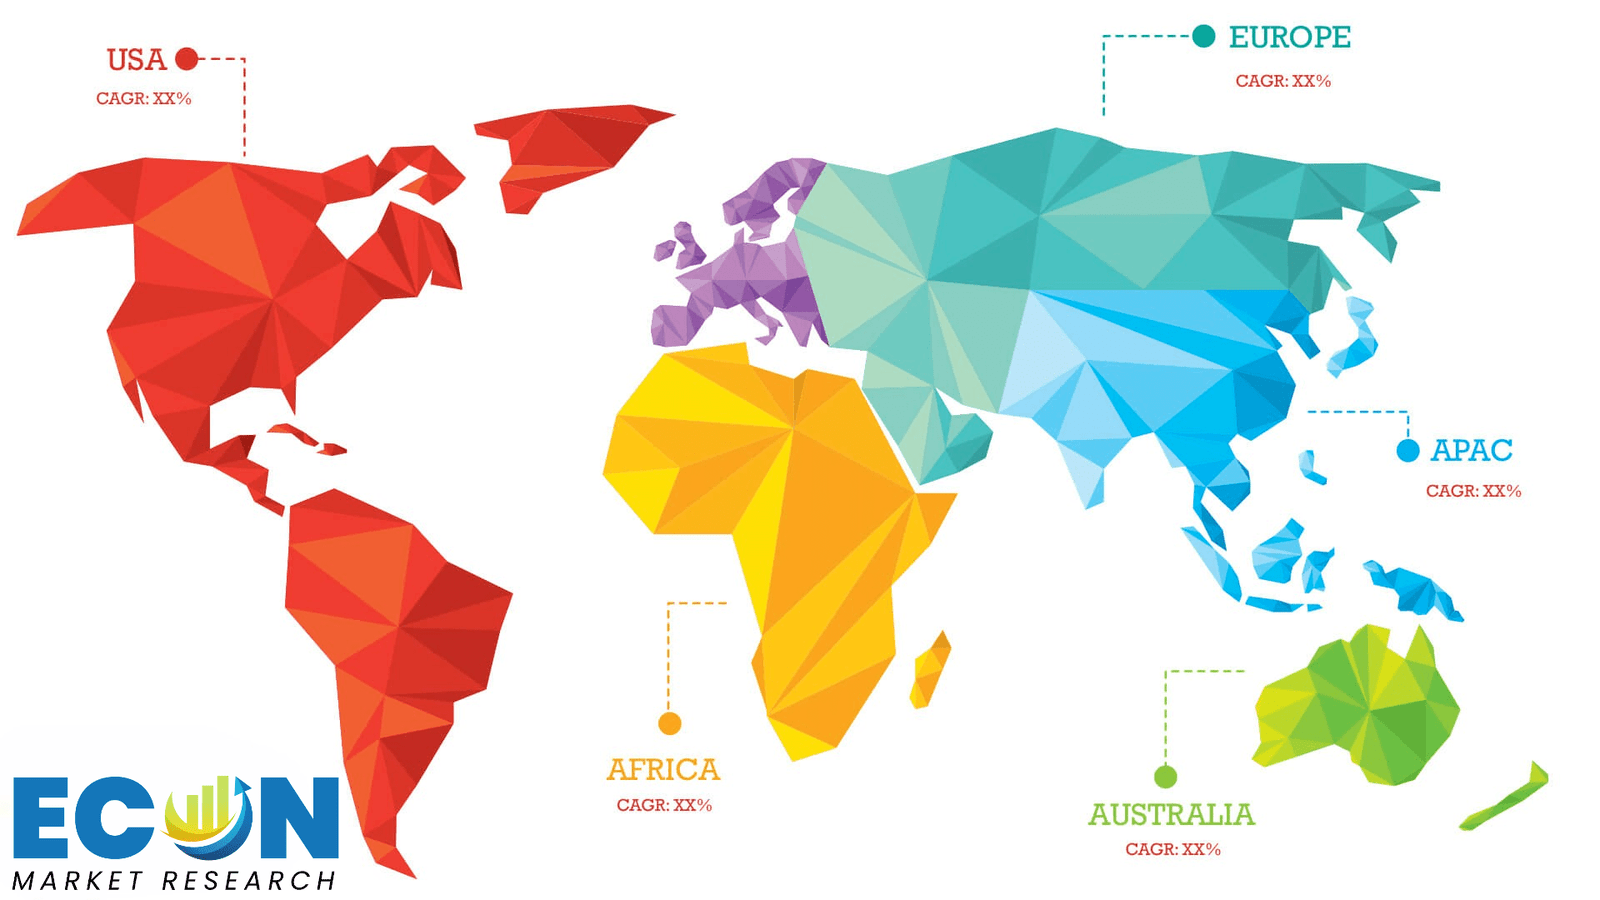
Global Ethernet Card Overview by Region
Developed regions like North America and Europe lead in terms of market share, driven by robust IT infrastructure, high internet penetration rates, and early adoption of advanced networking technologies. North America, particularly the United States, holds a significant market share, fueled by the presence of key market players, technological innovation hubs, and extensive investments in digital infrastructure projects. Similarly, Europe boasts a mature Ethernet Card market, with countries like Germany, the UK, and France at the forefront of adoption.
In Asia-Pacific, rapid industrialization, urbanization, and the proliferation of internet-enabled devices drive market growth. Countries like China, Japan, and South Korea are witnessing increased demand for Ethernet cards, fueled by government initiatives to expand digital connectivity and support emerging technologies such as 5G and IoT. Furthermore, the Asia-Pacific region benefits from a large manufacturing base, contributing to the production and export of Ethernet card components.
Emerging markets in Latin America, the Middle East, and Africa present untapped opportunities for market expansion, driven by increasing investments in telecommunications infrastructure, rising internet penetration, and growing demand for enterprise networking solutions. However, these regions also face challenges such as regulatory complexities, infrastructure gaps, and economic uncertainties, which may impede market growth to some extent.
Global Ethernet Card market competitive landscape
Leading companies such as Intel Corporation, Broadcom Inc., Marvell Technology Group, Realtek Semiconductor Corp., and Mellanox Technologies Ltd. command significant market shares, leveraging their strong R&D capabilities, extensive product portfolios, and global distribution networks to maintain competitive advantages. These players continually innovate to introduce advanced Ethernet card solutions with enhanced performance, reliability, and compatibility, catering to evolving customer demands and technological trends. Moreover, partnerships and collaborations with industry stakeholders, including network equipment manufacturers, cloud service providers, and telecommunications companies, enable market incumbents to expand their market presence and address emerging market opportunities. Alongside established players, the market also witnesses the emergence of niche players and start-ups offering specialized Ethernet card solutions targeting specific industry verticals or niche applications. While these players may lack the scale and resources of larger competitors, they often focus on innovation and agility to carve out market niches and gain traction in specific segments.
Global Ethernet Card Recent Developments
Scope of global Ethernet Card report
Global Ethernet Card report segmentation
|
ATTRIBUTE |
DETAILS |
|
By Speed |
|
|
By Form Factor |
|
|
By End User |
|
|
By Application |
|
|
By Geography |
|
|
Customization Scope |
|
|
Pricing |
|
Objectives of the Study
The objectives of the study are summarized in 5 stages. They are as mentioned below:
Research Methodology
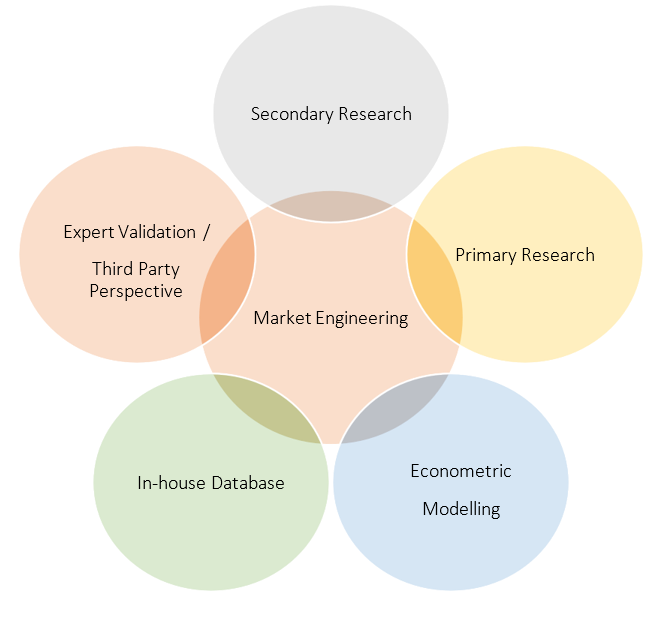
Our research methodology has always been the key differentiating reason which sets us apart in comparison from the competing organizations in the industry. Our organization believes in consistency along with quality and establishing a new level with every new report we generate; our methods are acclaimed and the data/information inside the report is coveted. Our research methodology involves a combination of primary and secondary research methods. Data procurement is one of the most extensive stages in our research process. Our organization helps in assisting the clients to find the opportunities by examining the market across the globe coupled with providing economic statistics for each and every region. The reports generated and published are based on primary & secondary research. In secondary research, we gather data for global Market through white papers, case studies, blogs, reference customers, news, articles, press releases, white papers, and research studies. We also have our paid data applications which includes hoovers, Bloomberg business week, Avention, and others.
Data Collection
Data collection is the process of gathering, measuring, and analyzing accurate and relevant data from a variety of sources to analyze market and forecast trends. Raw market data is obtained on a broad front. Data is continuously extracted and filtered to ensure only validated and authenticated sources are considered. Data is mined from a varied host of sources including secondary and primary sources.
Primary Research
After the secondary research process, we initiate the primary research phase in which we interact with companies operating within the market space. We interact with related industries to understand the factors that can drive or hamper a market. Exhaustive primary interviews are conducted. Various sources from both the supply and demand sides are interviewed to obtain qualitative and quantitative information for a report which includes suppliers, product providers, domain experts, CEOs, vice presidents, marketing & sales directors, Type & innovation directors, and related key executives from various key companies to ensure a holistic and unbiased picture of the market.
Secondary Research
A secondary research process is conducted to identify and collect information useful for the extensive, technical, market-oriented, and comprehensive study of the market. Secondary sources include published market studies, competitive information, white papers, analyst reports, government agencies, industry and trade associations, media sources, chambers of commerce, newsletters, trade publications, magazines, Bloomberg BusinessWeek, Factiva, D&B, annual reports, company house documents, investor presentations, articles, journals, blogs, and SEC filings of companies, newspapers, and so on. We have assigned weights to these parameters and quantified their market impacts using the weighted average analysis to derive the expected market growth rate.
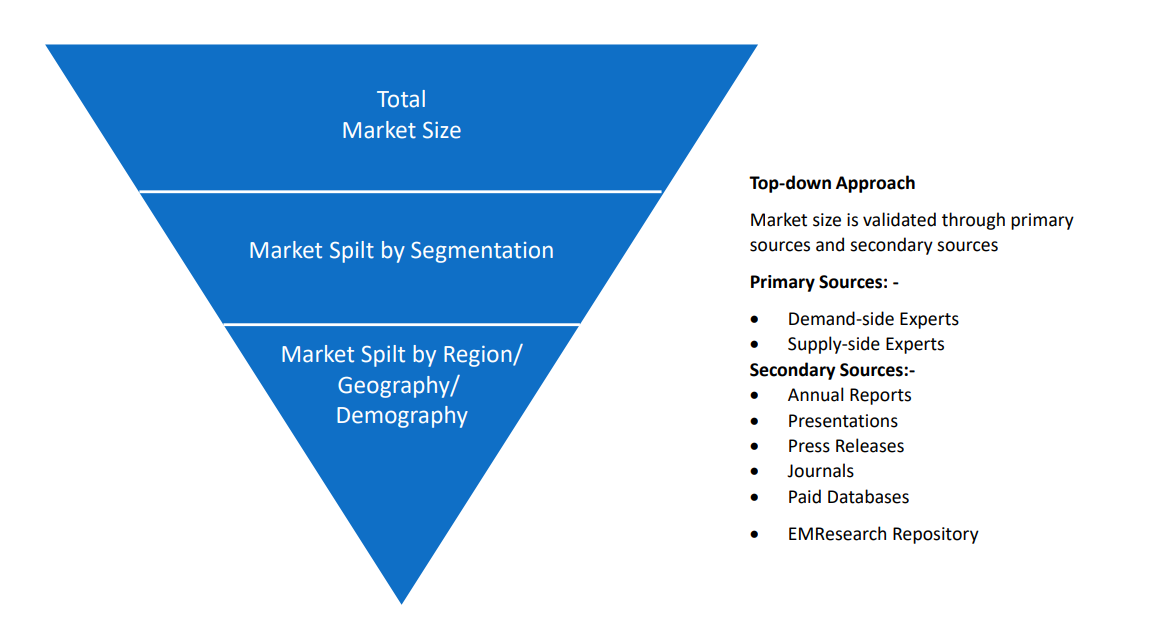
Top-Down Approach & Bottom-Up Approach
In the top – down approach, the Global Batteries for Solar Energy Storage Market was further divided into various segments on the basis of the percentage share of each segment. This approach helped in arriving at the market size of each segment globally. The segments market size was further broken down in the regional market size of each segment and sub-segments. The sub-segments were further broken down to country level market. The market size arrived using this approach was then crosschecked with the market size arrived by using bottom-up approach.
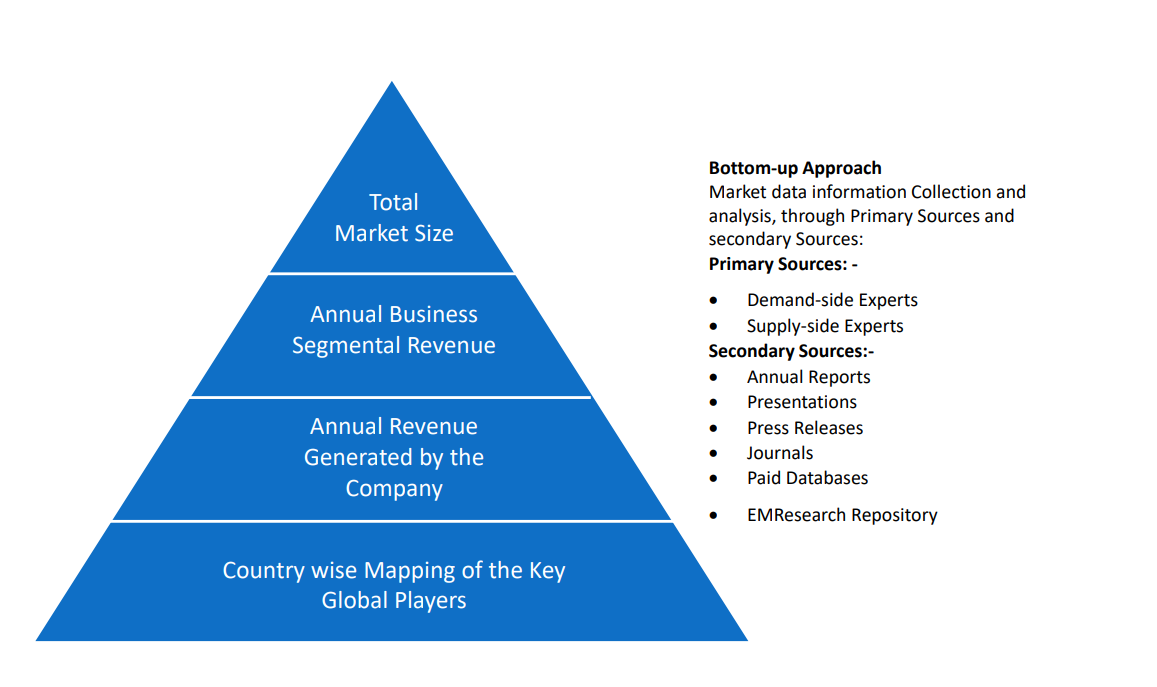
In the bottom-up approach, we arrived at the country market size by identifying the revenues and market shares of the key market players. The country market sizes then were added up to arrive at regional market size of the decorated apparel, which eventually added up to arrive at global market size.
This is one of the most reliable methods as the information is directly obtained from the key players in the market and is based on the primary interviews from the key opinion leaders associated with the firms considered in the research. Furthermore, the data obtained from the company sources and the primary respondents was validated through secondary sources including government publications and Bloomberg.
Market Analysis & size Estimation
Post the data mining stage, we gather our findings and analyze them, filtering out relevant insights. These are evaluated across research teams and industry experts. All this data is collected and evaluated by our analysts. The key players in the industry or markets are identified through extensive primary and secondary research. All percentage share splits, and breakdowns have been determined using secondary sources and verified through primary sources. The market size, in terms of value and volume, is determined through primary and secondary research processes, and forecasting models including the time series model, econometric model, judgmental forecasting model, the Delphi method, among Flywheel Energy Storage. Gathered information for market analysis, competitive landscape, growth trends, product development, and pricing trends is fed into the model and analyzed simultaneously.
Quality Checking & Final Review
The analysis done by the research team is further reviewed to check for the accuracy of the data provided to ensure the clients’ requirements. This approach provides essential checks and balances which facilitate the production of quality data. This Type of revision was done in two phases for the authenticity of the data and negligible errors in the report. After quality checking, the report is reviewed to look after the presentation, Type and to recheck if all the requirements of the clients were addressed.