Global Data Analytics in Transportation Market Research Report: By Component (Software, ServicesBy Application (Customer Analytics and Loyalty Marketing, Customer and Pricing Optimization, Predictive Maintenance Analytics, Others), and Region (North America, Europe, Asia-Pacific, and Rest of the World) Global Industry Analysis, Size, Share, Growth, Trends, Regional Analysis, Competitor Analysis and Forecast 2023-2031.
The Global Data Analytics in Transportation Market was valued at USD 2.12 billion in 2022 and is estimated to reach approximately USD 24.98 billion by 2031, at a CAGR of 31.5% from 2023 to 2031. In order to generate insights that enhance efficiency, safety, and decision-making in the transportation sector, data analytics in transportation entails gathering and analyzing data from a variety of sources, including cars, sensors, and traffic patterns. Routes are improved, traffic is lessened, maintenance schedules are improved, and the whole transportation system is improved. Transportation stakeholders can improve the infrastructure and services they provide, benefiting both the flow of people and products, by utilizing data-driven initiatives. In recent years, the subject of transport data analytics has undergone a remarkable expansion and evolution. The need for effective and sustainable transport networks is greater than ever as urbanization picks up speed. In order to manage the complicated issues the transportation sector faces, data analytics is essential. The gathering, processing, and analysis of enormous volumes of data produced from numerous sources throughout the transportation ecosystem characterizes this business. These sources include cellphones, GPS units, traffic cameras, sensors on infrastructure and cars, and even mobile phones. Transportation businesses, governmental organizations, and other stakeholders can learn a lot about traffic patterns, infrastructure performance, and consumer behaviour by utilizing this data. Data analytics has many different uses in the transportation industry. It allows for route optimization, which lowers fuel use and greenhouse gas emissions. Predictive maintenance reduces downtime while extending the lifespan of infrastructure and vehicles. Systems for real-time traffic control reduce congestion and enhance security. Additionally, data analytics contributes to the creation of intelligent transportation systems, smart cities, and autonomous vehicles.A increasing focus on sustainability, improvements in machine learning algorithms, and breakthroughs in data collection technology are all driving the market for data analytics in transportation to grow even more. Effective mobility strategies supported by data analytics will be crucial for developing smarter, safer, and more sustainable urban environments as cities continue to change. In the upcoming years, this market will be a focus for investment and development because it offers innovation and economic benefits.
![]()
DATA ANALYTICS IN TRANSPORTATION MARKET: REPORT SCOPE & SEGMENTATION
|
Report Attribute |
Details |
|
Estimated Market Value (2022) |
2.12 Bn |
|
Projected Market Value (2031) |
24.98 Bn |
|
Base Year |
2022 |
|
Forecast Years |
2023 - 2031 |
|
Scope of the Report |
Historical and Forecast Trends, Industry Drivers and Constraints, Historical and Forecast Market Analysis by Segment- By Component , By Application, & Region |
|
Segments Covered |
By Component , By Application, & Region |
|
Forecast Units |
Value (USD Billion or Million), and Volume (Units) |
|
Quantitative Units |
Revenue in USD million/billion and CAGR from 2023 to 2031 |
|
Regions Covered |
North America, Europe, Asia Pacific, Latin America, and Middle East & Africa, and the Rest of World |
|
Countries Covered |
U.S., Canada, Mexico, U.K., Germany, France, Italy, Spain, China, India, Japan, South Korea, Brazil, Argentina, GCC Countries, and South Africa, among others |
|
Report Coverage |
Market growth drivers, restraints, opportunities, Porter’s five forces analysis, PEST analysis, value chain analysis, regulatory landscape, market attractiveness analysis by segments and region, company market share analysis, and COVID-19 impact analysis. |
|
Delivery Format |
Delivered as an attached PDF and Excel through email, according to the purchase option. |
Global Data Analytics in Transportation Market Dynamics
The market for data analytics in transportation is exposed to a fluid environment that is shaped by a convergence of legislative changes, technical improvements, and shifting customer demands. Innovation in the transport sector is being driven by the spread of IoT devices, the expansion of 5G networks, and the development of more advanced data analytics techniques. Real-time data collecting and analysis made possible by these technologies improves consumer satisfaction, efficiency, and safety. Congestion in cities continues to rise as a result of rapid urbanization. Data analytics is a crucial tool for both public and commercial businesses since it helps control traffic flow, minimize gridlock, and optimize public transit. Regulations and environmental concerns are driving the transportation industry to adopt more sustainable practices. Data analytics assists in monitoring emissions, optimizing fuel consumption, and promoting the adoption of electric and autonomous vehicles. Consumer tastes are shifting in favour of individualized and on-demand transportation options. In order to fulfil the demands of today's tech-savvy travellers, organizations can employ data analytics to customize services, improve customer experiences, and optimize routes. Governments all throughout the world are increasingly supporting data-driven projects to increase the efficiency and safety of transportation. The incorporation of data analytics into transport infrastructure and operations is supported by legislation and financing schemes. The market for data analytics in transportation is seeing an influx of startups and well-established businesses, which is promoting competition and sparking innovation. New solutions and business models are constantly being developed as a result of this dynamic environment. As the volume of private transport information increases, data security and privacy compliance become a crucial issue. Gaining consumer trust and expanding the industry need addressing these difficulties.
Global Data Analytics in Transportation Market Drivers
In urban locations around the world, traffic congestion is a major issue that results in lost time, higher fuel usage, and more pollution. By revealing important information about traffic patterns and the causes of congestion, data analytics plays a crucial part in solving this problem. Transportation authorities and businesses can get a real-time insight of traffic conditions by the gathering and analysis of data from numerous sources, including GPS devices, traffic cameras, and car sensors. These data are processed by data analytics technologies to quickly spot bottlenecks, accidents, or other interruptions. By suggesting alternate routes to commuters via navigational applications and digital signage, they can lessen traffic and travel times. Additionally, city planners and transportation organizations can use historical and current data to make educated judgement on infrastructure upgrades, signal timing modifications, and improvements to public transportation. Traffic congestion control offers many benefits than just reducing daily commutes. Due to less time spent idling in traffic, carbon emissions are decreased. By reducing the possibility of accidents brought on by traffic, it also increases road safety. Overall, reducing traffic congestion with data analytics not only benefits individual commuters but also helps our increasingly urbanized globe have more sustainable, effective, and safe transportation networks.
Adopting sustainable practices is essential because the transportation sector significantly contributes to global greenhouse gas emissions. In order to reduce emissions and promote sustainability, data analytics in transportation is essential to this effort. To reduce emissions and maximize fuel efficiency, data analytics systems collect and analyse enormous volumes of data from infrastructure, automobiles, and other sources. Insights regarding the effectiveness of routes, driver behaviour, and vehicle performance are provided by them. Data analytics may significantly lower carbon emissions by spotting chances for improvement, such as reducing mileage by optimizing routes, advising eco-friendly driving practices, and controlling vehicle maintenance schedules. Additionally, data analytics encourages the incorporation of hybrid and electric vehicles into fleets of transportation, facilitating the switch to cleaner forms of energy.
Restraints:
Data security and privacy are crucial factors in the field of transportation data analytics. Significant concerns are raised over the gathering, storing, and processing of sensitive transportation data, particularly data pertaining to people and their vehicles. PII, such as travel history, location, and even payment information, is frequently included in transportation data. To safeguard people's right to privacy, this information must be protected. Misuse or unauthorized access to PII can lead to privacy violations, legal repercussions, and reputational harm for a company. Due to the vitality of its infrastructure, the transport industry is a top target for cyberattacks. Hacking attempts can interfere with communication networks, affect traffic control systems, and jeopardize vehicle safety. Implementing robust encryption, access controls, and authentication mechanisms will allay these worries. Depending on the type of data acquired, organizations must additionally abide by data protection laws like GDPR or HIPAA. It is a dilemma that calls for cautious management to strike a balance between gathering data for analytical purposes and protecting people's right to privacy.
For many organizations, implementing advanced data analytics solutions in the transportation industry can be a considerable expensive commitment. The following elements affect implementation costs. Organizations frequently need to invest in hardware and software infrastructure in order to collect and manage transportation data effectively. This includes sensors, data storage options, advanced analytics software, and high-performance servers, all of which can be costly to buy and operate. It can be difficult and expensive to integrate data from diverse sources inside the transportation ecosystem. It takes a lot of resources to make sure that data from various sensors, vehicles, and infrastructure parts is compatible and can be processed smoothly.It takes money to hire, pay for, and train a staff of knowledgeable data scientists and analysts who comprehend the nuances of transportation data. Costs increase further as a result of the competition for such talent. Reliable analytics depend on the correctness, consistency, and fullness of the data. It can be time-consuming and expensive to implement quality control methods and data cleansing procedures.
Opportunities:
A revolutionary potential for data analytics in transport is being presented by the rise of smart cities and the expansion of the Internet of Things (IoT). Smart mobility solutions use data analytics to combine different forms of transit, giving commuters and locals alike a smooth and effective travel experience. Because transportation networks in smart cities are interconnected, commuters can easily switch between public transportation, ride sharing services, electric scooters, and other modes of mobility. In order to manage these sophisticated systems, data analytics are essential. To deliver real-time data on traffic conditions, transit timetables, and ride availability, it gathers and analyses data from a variety of sources, including mobile apps, GPS-enabled vehicles, sensors on roads, and sensors in buildings. The opportunity here is to build dynamic, data-driven transportation ecosystems that ease traffic, shorten commutes, and encourage environmentally friendly modes of mobility. Cities can fulfil their objectives of lowering traffic congestion and environmental impact, while commuters benefit from more convenience and reduced trip stress.
The use of data analytics in the transport sector has a compelling possibility to transform traffic control and reduce congestion in urban areas. An unprecedented amount of data has been made available by the widespread use of sensors, cameras, and GPS devices. When appropriately tapped, this data can revolutionize traffic monitoring and management. In order to deliver up-to-the-minute insights into traffic flow, congestion patterns, and incidents like accidents or road closures, real-time data analytics systems collect data from a variety of sources, including traffic cameras, vehicle sensors, and GPS devices. These insights can be used by transportation authorities to dynamically change traffic signals, reroute vehicles, and adopt congestion pricing plans, all of which are meant to improve traffic flow and lessen jams. Furthermore, using past data as well as outside variables like the weather or specific events, predictive analytics can forecast traffic patterns.
Segment Overview
By Component
Based on component, the global data analytics in transportation market is divided into software and services. The software category dominates the market with the largest revenue share. This segment encompasses the development, sale, and deployment of data analytics software solutions specifically designed for transportation applications. These software packages enable organizations to collect, process, and analyze vast amounts of transportation-related data efficiently. They often feature advanced data visualization, machine learning, and predictive analytics capabilities, allowing users to derive valuable insights from the data collected. Software solutions cater to various aspects of transportation, including traffic management, fleet optimization, route planning, and passenger experience enhancement. Customers can purchase these software products outright or subscribe to cloud-based platforms that offer scalability, flexibility, and access to the latest updates and features. The services segment includes a wide range of offerings provided by data analytics companies and consultants to support organizations in their transportation data initiatives. These services encompass data collection, integration, analysis, and reporting. Additionally, they may involve consulting services to help organizations design and implement data analytics strategies tailored to their specific transportation needs.
By Application
Based on application, the global data analytics in transportation market is segmented into customer analytics and loyalty marketing, customer and pricing optimization, predictive maintenance analytics, and others. The customer analytics and loyalty marketing segment dominates the data analytics in transportation market. This segment focuses on understanding customer behavior, preferences, and trends in the transportation industry. It involves collecting and analyzing data related to passenger or customer interactions, satisfaction, and loyalty. The insights derived from customer analytics are used to develop targeted marketing strategies, loyalty programs, and personalized services to enhance the overall passenger experience and retention rates. Airlines, public transit systems, and ride-sharing companies often utilize customer analytics and loyalty marketing to improve customer satisfaction and loyalty. Customer and pricing optimization, This segment is concerned with optimizing pricing strategies and revenue management within the transportation industry. Data analytics tools are employed to analyze market demand, competition, historical pricing data, and other variables to determine the most effective pricing structures. Predictive maintenance analytics involves the analysis of data from various sensors and monitoring systems in transportation assets such as vehicles, aircraft, or infrastructure. By using predictive algorithms, organizations can anticipate maintenance needs, schedule repairs proactively, and reduce downtime. This leads to cost savings, improved safety, and enhanced operational efficiency.
Global Data Analytics in Transportation Market Overview by Region
The global data analytics in transportation market is categorized into North America, Europe, Asia-Pacific, and the Rest of the World. North America emerged as the leading region, capturing the largest market share in 2022. In terms of innovation and uptake, North America has emerged as the industry leader in the field of data analytics for the transportation sector. Its prominence in this quickly changing business has been influenced by a number of reasons. Some of the most cutting-edge tech companies in the world are based in North America, supporting the creation and implementation of cutting-edge data analytics solutions. Startups and established businesses devoted to enhancing transportation analytics have concentrated in Silicon Valley in particular. The area has developed road, rail, airport, and urban transit networks, among other large transportation networks. Massive amounts of data produced by these intricate systems are ready for analysis and optimization. Governments and transportation authorities in North America have been proactive in embracing data analytics to manage traffic congestion, promote overall mobility, and improve public transit systems. Initiatives include investments in intelligent transport systems and smart city projects. Private businesses have realised the benefits of data analytics in expanding their services, from ride-sharing platforms to logistics behemoths. To optimise operations, cut costs, and enhance consumer experiences, they have made large investments in data analytics. Transportation analytics research has been spearheaded by eminent academic institutions and research hubs in North America. They offer a talent pool of data scientists and analysts that fuels the industry's innovation. The varied transportation ecosystem of North America includes a range of modes, from private automobiles and public transportation to aviation and ocean travel.
Global Data Analytics in Transportation Market Competitive Landscape
In the global data analytics in transportation market, a few major players exert significant market dominance and have established a strong regional presence. These leading companies remain committed to continuous research and development endeavors and actively engage in strategic growth initiatives, including product development, launches, joint ventures, and partnerships. By pursuing these strategies, these companies aim to strengthen their market position, expand their customer base, and capture a substantial share of the market.
Some of the prominent players in the global data analytics in transportation market include IBM Corporation, SAP SE, Microsoft Corporation, Oracle Corporation, SAS Institute Inc., OpenText Corporation, Microstrategy, Information Builders, Tableau Software Inc., Qlik Technologies Inc. and various other key players.
Global Data Analytics in Transportation Market Recent Developments
In April 2023, Trimble completes the acquisition of Transporeon. SwanLeap, Inc., a pioneering provider of transportation management software, has been acquired by Transportation Insight Holding Company, a top North American provider of non-asset, tech-enabled logistics and freight brokerage solutions. SwanLeap's multimodal TMS and strong analytics are combined with TI Holdco's end-to-end logistics services as part of the acquisition to create a comprehensive multimodal transportation management platform.
In February 2022, StreetLight Data, Inc., a leader in mobility analytics, is acquired by Jacobs. On-demand analytics from StreetLight are revolutionising transport and infrastructure solutions, enabling wiser, more significant investments.
Scope of the Global Data Analytics in Transportation Market Report
Data Analytics in Transportation Market Report Segmentation
|
ATTRIBUTE |
DETAILS |
|
By Component |
|
|
By Application |
|
|
By Geography |
|
|
Customization Scope |
|
|
Pricing |
|
Objectives of the Study
The objectives of the study are summarized in 5 stages. They are as mentioned below:
To identify and estimate the market size for the global data analytics in transportation market segmented by component , by application, region and by value (in U.S. dollars). Also, to understand the consumption/ demand created by consumers of data analytics in transportation between 2019 and 2031.
To identify and infer the drivers, restraints, opportunities, and challenges for the global data analytics in transportation market
To find out the factors which are affecting the sales of data analytics in transportation among consumers
To identify and understand the various factors involved in the global data analytics in transportation market affected by the pandemic
To provide a detailed insight into the major companies operating in the market. The profiling will include the financial health of the company's past 2-3 years with segmental and regional revenue breakup, product offering, recent developments, SWOT analysis, and key strategies.
Intended Audience
Research Methodology
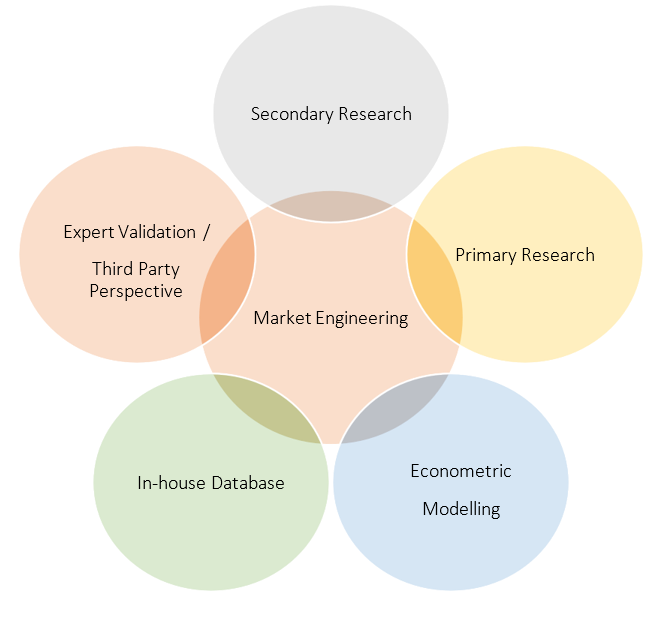
Our research methodology has always been the key differentiating reason which sets us apart in comparison from the competing organizations in the industry. Our organization believes in consistency along with quality and establishing a new level with every new report we generate; our methods are acclaimed and the data/information inside the report is coveted. Our research methodology involves a combination of primary and secondary research methods. Data procurement is one of the most extensive stages in our research process. Our organization helps in assisting the clients to find the opportunities by examining the market across the globe coupled with providing economic statistics for each and every region. The reports generated and published are based on primary & secondary research. In secondary research, we gather data for global Market through white papers, case studies, blogs, reference customers, news, articles, press releases, white papers, and research studies. We also have our paid data applications which includes hoovers, Bloomberg business week, Avention, and others.
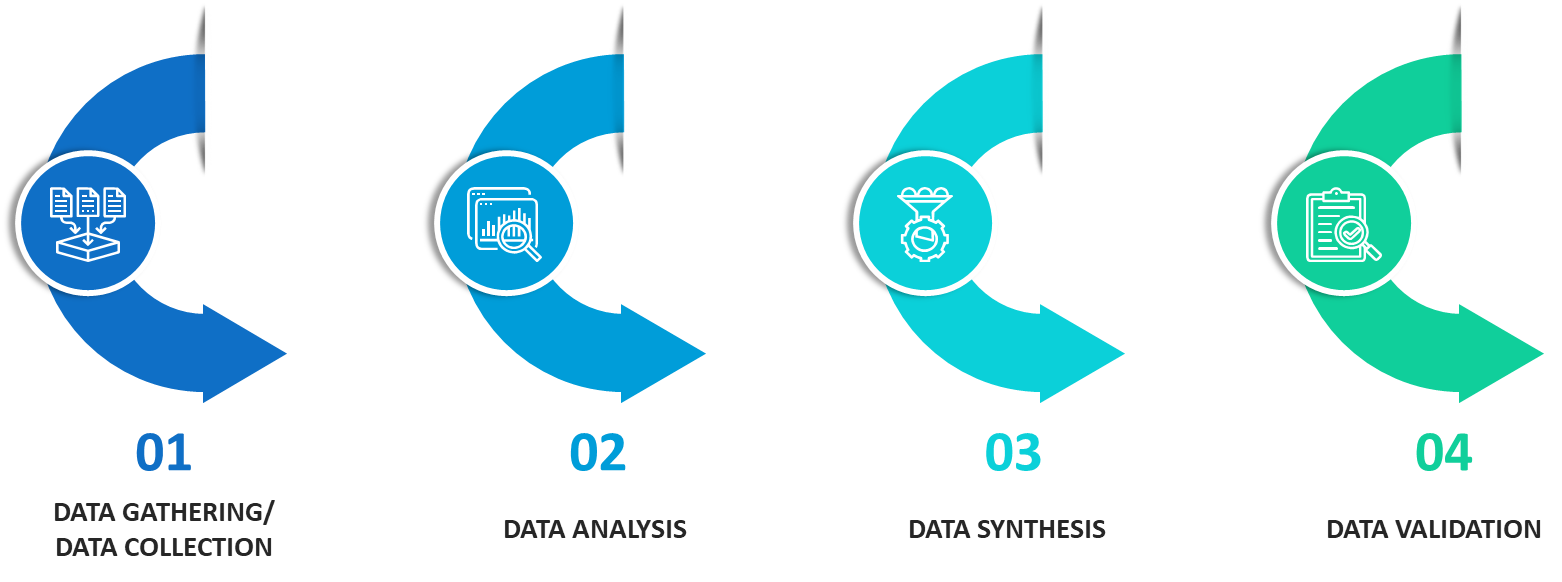
Data Collection
Data collection is the process of gathering, measuring, and analyzing accurate and relevant data from a variety of sources to analyze market and forecast trends. Raw market data is obtained on a broad front. Data is continuously extracted and filtered to ensure only validated and authenticated sources are considered. Data is mined from a varied host of sources including secondary and primary sources.
Primary Research
After the secondary research process, we initiate the primary research phase in which we interact with companies operating within the market space. We interact with related industries to understand the factors that can drive or hamper a market. Exhaustive primary interviews are conducted. Various sources from both the supply and demand sides are interviewed to obtain qualitative and quantitative information for a report which includes suppliers, product providers, domain experts, CEOs, vice presidents, marketing & sales directors, Type & innovation directors, and related key executives from various key companies to ensure a holistic and unbiased picture of the market.
Secondary Research
A secondary research process is conducted to identify and collect information useful for the extensive, technical, market-oriented, and comprehensive study of the market. Secondary sources include published market studies, competitive information, white papers, analyst reports, government agencies, industry and trade associations, media sources, chambers of commerce, newsletters, trade publications, magazines, Bloomberg BusinessWeek, Factiva, D&B, annual reports, company house documents, investor presentations, articles, journals, blogs, and SEC filings of companies, newspapers, and so on. We have assigned weights to these parameters and quantified their market impacts using the weighted average analysis to derive the expected market growth rate.
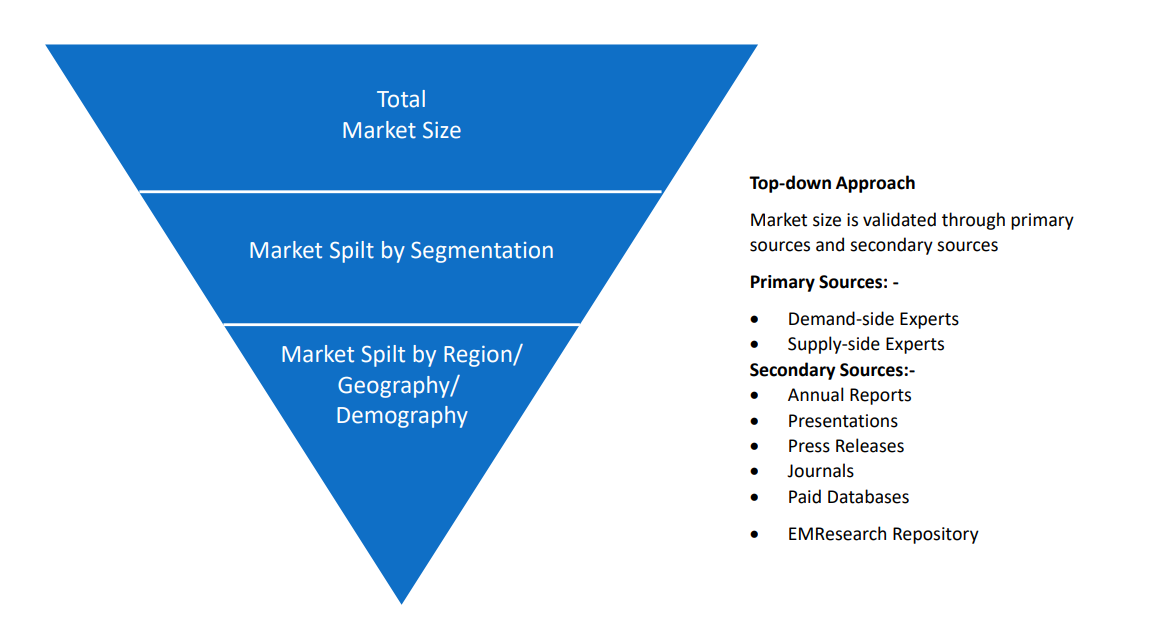
Top-Down Approach & Bottom-Up Approach
In the top – down approach, the Global Batteries for Solar Energy Storage Market was further divided into various segments on the basis of the percentage share of each segment. This approach helped in arriving at the market size of each segment globally. The segments market size was further broken down in the regional market size of each segment and sub-segments. The sub-segments were further broken down to country level market. The market size arrived using this approach was then crosschecked with the market size arrived by using bottom-up approach.
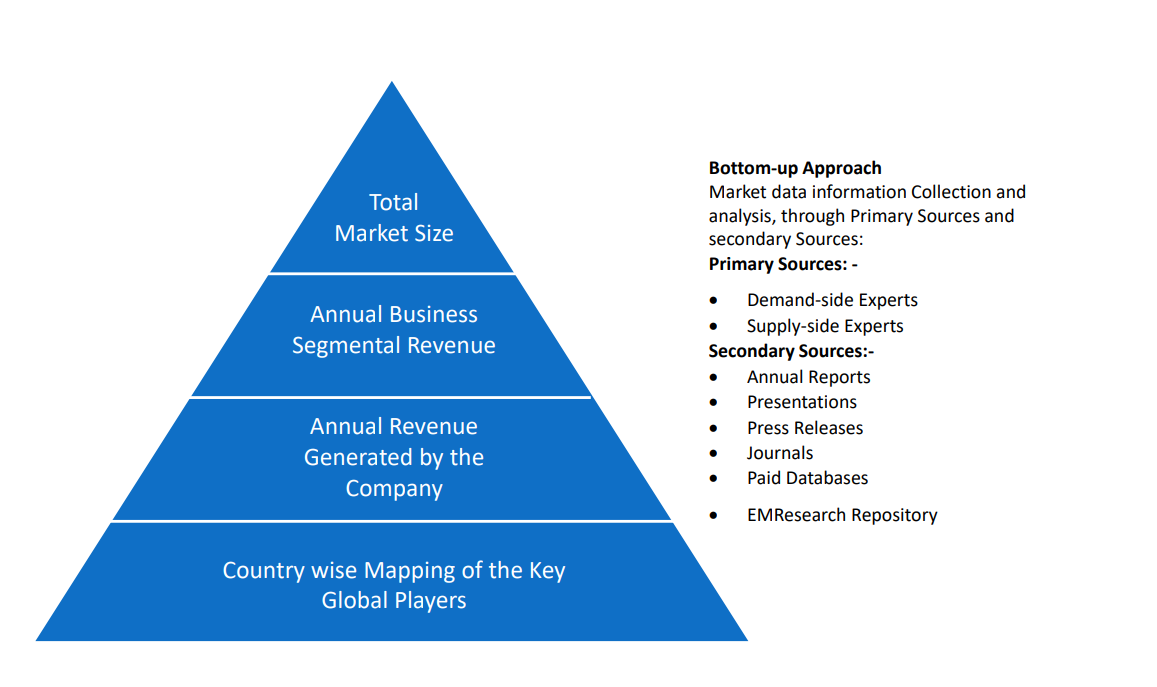
In the bottom-up approach, we arrived at the country market size by identifying the revenues and market shares of the key market players. The country market sizes then were added up to arrive at regional market size of the decorated apparel, which eventually added up to arrive at global market size.
This is one of the most reliable methods as the information is directly obtained from the key players in the market and is based on the primary interviews from the key opinion leaders associated with the firms considered in the research. Furthermore, the data obtained from the company sources and the primary respondents was validated through secondary sources including government publications and Bloomberg.
Market Analysis & size Estimation
Post the data mining stage, we gather our findings and analyze them, filtering out relevant insights. These are evaluated across research teams and industry experts. All this data is collected and evaluated by our analysts. The key players in the industry or markets are identified through extensive primary and secondary research. All percentage share splits, and breakdowns have been determined using secondary sources and verified through primary sources. The market size, in terms of value and volume, is determined through primary and secondary research processes, and forecasting models including the time series model, econometric model, judgmental forecasting model, the Delphi method, among Flywheel Energy Storage. Gathered information for market analysis, competitive landscape, growth trends, product development, and pricing trends is fed into the model and analyzed simultaneously.
Quality Checking & Final Review
The analysis done by the research team is further reviewed to check for the accuracy of the data provided to ensure the clients’ requirements. This approach provides essential checks and balances which facilitate the production of quality data. This Type of revision was done in two phases for the authenticity of the data and negligible errors in the report. After quality checking, the report is reviewed to look after the presentation, Type and to recheck if all the requirements of the clients were addressed.